
KNOWPIA
WELCOME TO KNOWPIA

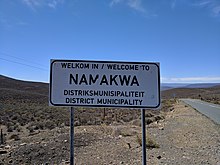
Namakwa District Municipality 
Summary
The Namakwa District Municipality (Afrikaans: Namakwa-distriksmunisipaliteit) is one of the 5 districts of the Northern Cape province of South Africa. The seat of Namakwa is Springbok and the region is also known as Little Namaqualand. As of 2011, a majority of its 108,118 residents speak Afrikaans. The district code is DC6.
Namakwa | |
|---|---|
 Seal | |
 Location in South Africa | |
| Coordinates: 30°30′S 19°30′E / 30.500°S 19.500°E | |
| Country | South Africa |
| Province | Northern Cape |
| Seat | Springbok |
| Local municipalities | |
| Government | |
| • Type | Municipal council |
| • Mayor | Mervin Cloete |
| Area | |
| • Total | 126,836 km2 (48,972 sq mi) |
| Population (2011)[2] | |
| • Total | 115,842 |
| • Density | 0.91/km2 (2.4/sq mi) |
| Racial makeup (2011) | |
| • Black African | 6.8% |
| • Coloured | 83.2% |
| • Indian/Asian | 0.5% |
| • White | 8.7% |
| First languages (2011) | |
| • Afrikaans | 93.9% |
| • Tswana | 1.7% |
| • Xhosa | 1.5% |
| • English | 1.2% |
| • Other | 1.7% |
| Time zone | UTC+2 (SAST) |
| Municipal code | DC6 |
Geography edit
Neighbours edit
Namakwa is surrounded by:
- the republic of Namibia in the north
- ZF Mgcawu (DC8) in the north-east
- Pixley ka Seme (DC7) in the east
- Central Karoo (DC5) in the south-east
- Cape Winelands (DC2) – in the south (formerly the Boland District Municipality)
- West Coast (DC1) in the south-west
- the Atlantic Ocean in the west
Local municipalities edit
The district contains the following local municipalities:
| Local municipality | Population | % |
|---|---|---|
| Nama Khoi | 44 752 | 41.39% |
| Hantam | 19 804 | 18.32% |
| Khâi-Ma | 11 348 | 10.50% |
| Kamiesberg | 10 743 | 9.94% |
| Karoo Hoogland | 10 508 | 9.72% |
| Richtersveld | 10 119 | 9.36% |
| Namaqualand | 813 | 0.75% |
Demographics edit
The following statistics are from the 2001 census.
| Language | Population | % |
|---|---|---|
| Afrikaans | 103,304 | 95.55% |
| Xhosa | 1 595 | 1.48% |
| Tswana | 1 211 | 1.12% |
| English | 1 143 | 1.06% |
| Other | 415 | 0.38% |
| Sotho | 219 | 0.20% |
| Zulu | 116 | 0.11% |
| Tsonga | 26 | 0.02% |
| Northern Sotho | 18 | 0.02% |
| Venda | 16 | 0.01% |
| Swati | 15 | 0.01% |
| Ndebele | 9 | 0.01% |
Gender edit
| Gender | Population | % |
|---|---|---|
| Female | 54 651 | 50.55% |
| Male | 53 467 | 49.45% |
Ethnic group edit
| Ethnic group | Population | % |
|---|---|---|
| Coloured | 90 713 | 83.90% |
| White | 12 757 | 11.80% |
| Black African | 4 523 | 4.18% |
| Indian/Asian | 125 | 0.12% |
Age edit
| Age | Population | % |
|---|---|---|
| 000–004 | 9 990 | 9.24% |
| 005–009 | 10 690 | 9.89% |
| 010–014 | 11 028 | 10.20% |
| 015–019 | 9 809 | 9.07% |
| 020–024 | 8 212 | 7.60% |
| 025–029 | 8 367 | 7.74% |
| 030–034 | 8 647 | 8.00% |
| 035–039 | 8 086 | 7.48% |
| 040–044 | 6 996 | 6.47% |
| 045–049 | 6 387 | 5.91% |
| 050–054 | 4 971 | 4.60% |
| 055–059 | 4 232 | 3.91% |
| 060–064 | 3 437 | 3.18% |
| 065–069 | 2 671 | 2.47% |
| 070–074 | 1 929 | 1.78% |
| 075–079 | 1 216 | 1.12% |
| 080–084 | 786 | 0.73% |
| 085–089 | 453 | 0.42% |
| 090–094 | 165 | 0.15% |
| 095–099 | 43 | 0.04% |
| 100 plus | 3 | 0.00% |
Politics edit
Election results edit
Election results for Namakwa in the South African general election, 2004.
- Population 18 and over: 70 397 [65.11% of total population]
- Total votes: 44 220 [40.90% of total population]
- Voting % estimate: 62.82% votes as a % of population 18 and over
| Party | Votes | % |
|---|---|---|
| African National Congress | 26 557 | 60.06% |
| Democratic Alliance | 7 104 | 16.07% |
| New National Party | 4 379 | 9.90% |
| Independent Democrats | 4 216 | 9.53% |
| African Christian Democratic Party | 867 | 1.96% |
| Freedom Front Plus | 536 | 1.21% |
| Pan Africanist Congress | 75 | 0.17% |
| United Democratic Movement | 63 | 0.14% |
| United Christian Democratic Party | 54 | 0.12% |
| Inkhata Freedom Party | 49 | 0.11% |
| NA | 42 | 0.09% |
| EMSA | 39 | 0.09% |
| PJC | 38 | 0.09% |
| KISS | 37 | 0.08% |
| Azanian People's Organisation | 34 | 0.08% |
| CDP | 28 | 0.06% |
| SOPA | 27 | 0.06% |
| TOP | 23 | 0.05% |
| NLP | 20 | 0.05% |
| UF | 18 | 0.04% |
| Minority Front | 14 | 0.03% |
| Total | 44 220 | 100.00% |
References edit
External links edit
- Official Website for Namakwa District Municipality