


Summary
The near-infrared (NIR) window (also known as optical window or therapeutic window) defines the range of wavelengths from 650 to 1350 nanometre (nm) where light has its maximum depth of penetration in tissue.[1] Within the NIR window, scattering is the most dominant light-tissue interaction, and therefore the propagating light becomes diffused rapidly. Since scattering increases the distance travelled by photons within tissue, the probability of photon absorption also increases. Because scattering has weak dependence on wavelength, the NIR window is primarily limited by the light absorption of blood at short wavelengths and water at long wavelengths. The technique using this window is called NIRS. Medical imaging techniques such as fluorescence image-guided surgery often make use of the NIR window to detect deep structures.
Absorption properties of tissue components edit
The absorption coefficient ( ) is defined as the probability of photon absorption in tissue per unit path length.[2] Different tissue components have different values. Moreover, is a function of wavelength. Discussed below are the absorption properties of the most important chromophores in tissue. The molar extinction coefficient ( ) is another parameter that is used to describe photon absorption in tissue. By multiplying by the molar concentration and by ln(10), one can convert to .


Blood edit
Blood consists of two different types of hemoglobin: oxyhemoglobin ( ) is bound to oxygen, while deoxyhemoglobin ( ) is unbound to oxygen. These two different types of hemoglobin exhibit different absorption spectra that are normally represented in terms of molar extinction coefficients, as shown in Figure 1. The molar extinction coefficient of Hb has its highest absorption peak at 420 nm and a second peak at 580 nm. Its spectrum then gradually decreases as light wavelength increases. On the other hand, shows its highest absorption peak at 410 nm, and two secondary peaks at 550 nm and 600 nm. As light wavelengths passes 600 nm, absorption decays much faster than Hb absorption. The points where the molar extinction coefficient spectra of and intersect are called isosbestic points.


By using two different wavelengths, it is possible to calculate the concentrations of oxyhemoglobin ( ) and deoxyhemoglobin ( ) as shown in the following equations:


Here, and are the two wavelengths; and are the molar extinction coefficients of and , respectively; and are the molar concentrations of and in tissue, respectively. Oxygen saturation ( ) can then be computed as


Water edit
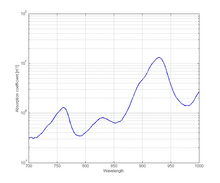
Although water is nearly transparent in the range of visible light, it becomes absorbing over the near-infrared region. Water is a critical component since its concentration is high in human tissue. The absorption spectrum of water in the range from 250 to 1000 nm is shown in Figure 2. Although absorption is rather low in this spectral range, it still contributes to the overall attenuation of tissue.

Other tissue components with less significant contributions to the total absorption spectrum of tissue are melanin and fat.
Melanin edit
Melanin is a chromophore that exists in the human epidermal layer of skin responsible for protection from harmful UV radiation. When melanocytes are stimulated by solar radiation, melanin is produced.[7] Melanin is one of the major absorbers of light in some biological tissue (although its contribution is smaller than other components). There are two types of melanin: eumelanin which is black-brown and pheomelanin which is red-yellow.[8] The molar extinction coefficient spectra corresponding to both types are shown in Figure 3.
Fat edit
Fat is one of the major components in tissue that can comprise 10–40% of tissue. Although not many mammalian fat spectra are available, Figure 4 shows an example extracted from pig fat.[9]

Scattering properties of tissue components edit
Optical scattering occurs due to mismatches in refractive index of the different tissue components, ranging from cell membranes to whole cells. Cell nuclei and mitochondria are the most important scatterers.[11] Their dimensions range from 100 nm to 6 μm, and thus fall within the NIR window. Most of these organelles fall in the Mie scattering regime, and exhibit highly anisotropic forward-directed scattering.[12]
Light scattering in biological tissue is denoted by the scattering coefficient ( ), which is defined as the probability of photon scattering in tissue per unit path length.[13] Figure 5 shows a plot of the scattering spectrum.[14]

Effective attenuation coefficient edit
Attenuation of light in deep biological tissue depends on the effective attenuation coefficient ( ), which is defined as


where is the transport scattering coefficient defined as


where is the anisotropy of biological tissue, which has a representative value of 0.9. Figure 5 shows a plot of transport scattering coefficient spectrum in breast tissue, which has a wavelength dependence of .[15] The effective attenuation coefficient is the dominant factor for determining light attenuation at depth ≫ 1/ .


Estimation edit
The NIR window can be computed based on the absorption coefficient spectrum or the effective attenuation coefficient spectrum. A possible criterion for selecting the NIR window is given by the FWHM of the inverse of these spectra as shown in Figure 7.
In addition to the total concentration of hemoglobin, the oxygen saturation will define the concentration of oxy- and deoxyhemoglobin in tissue and so the total absorption spectrum. Depending on the type of tissue, we can consider different situations. Below, the total concentration of hemoglobin is assumed to be 2.3 mM.
Absorption coefficient: λmin = 686 nm; NIR window = (634–756) nm.
Effective attenuation coefficient: λmin = 690 nm; NIR window = (618–926) nm.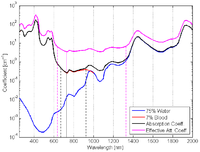
Absorption coefficient: λmin = 730 nm; NIR window = (664–932) nm.
Effective attenuation coefficient: λmin = 730 nm; NIR window = (630–1328) nm.
Absorption coefficient: λmin = 730 nm; NIR window = (656–916) nm.
Effective attenuation coefficient: λmin = 730 nm; NIR window = (626–1316) nm.Absorption spectrum for arteries edit
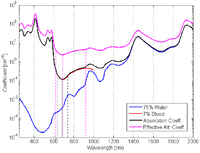
In this case ≈ 98% (arterial oxygen saturation). Then oxyhemoglobin will be dominant in the total absorption (black) and the effective attenuation (magenta) coefficient spectra, as shown in Figure 6 (a). 'cite: Anisotropic diffusion filter for dorsal hand vein features extraction – Sarah Hachemi Benziane, Abdelkader Benyettou'

Absorption spectrum for veins edit
In this case ≈ 60% (venous oxygen saturation). Then oxyhemoglobin and deoxyhemoglobin will have similar contributions to the total absorption (black) and the effective attenuation (magenta) coefficient spectra, as shown in Figure 6 (b).


Absorption spectrum for breast tissue edit
To define (tissue oxygen saturation) (or (tissue saturation index)), it is necessary to define a distribution of arteries and veins in tissue. an arterial-venous blood volume ratio of 20%/80% can be adopted.[16] Thus tissue oxygen saturation can be defined as = 0.2 x + 0.8 x ≈ 70%.


The total absorption (black) and the effective attenuation (magenta) coefficient spectra for breast tissue is shown in Figure 6 (c). In addition, the effective penetration depth is plotted in Figure 7.
See also edit
References edit
- ^ Smith, Andrew M.; Mancini, Michael C.; Nie, Shuming (2009). "Bioimaging: Second window for in vivo imaging". Nature Nanotechnology. 4 (11): 710–711. Bibcode:2009NatNa...4..710S. doi:10.1038/nnano.2009.326. ISSN 1748-3387. PMC 2862008. PMID 19898521.
- ^ LV. Wang and HI. Wu, Biomedical Optics. Wiley. ISBN 978-0-471-74304-0, 2007.
- ^ Molar extinction coefficients of oxy and deoxyhemoglobin compiled by Scott Prahl. URL: http://omlc.ogi.edu/spectra/hemoglobin.
- ^ G. M. Hale, and M. R. Querry, Optical constants of water in the 200 nm to 200 µm wavelength region, Appl. Opt., 12, 555–563, 1973.
- ^ Extinction coefficient of melanin by Steven Jacques. URL: http://omlc.ogi.edu/spectra/melanin/extcoeff.html.
- ^ R.L.P. van Veen, H.J.C.M. Sterenborg, A. Pifferi, A. Torricelli, and R. Cubeddu, OSA Annual BIOMED Topical Meeting, 2004.
- ^ T. Vo-Dinh, Biomedical Photonics Handbook. Taylor & Francis, Inc. ISBN 0-8493-1116-0, 2002.
- ^ George Zonios and Aikaterini Dimou, Ioannis Bassukas, Dimitrios Galaris, and Argyrios Ysolakidis and Efthimios Kaxiras, J. Biomed. Opt., Vol.13, 014017, 2008.
- ^ R.L.P. van Veen, H.J.C.M. Sterenborg, A. Pifferi, A. Torricelli, and R. Cubeddu, OSA Annual BIOMED Topical Meeting, 2004.
- ^ S. Jacques, C. Newman, D. Levy, and A. von Eschenbach. Univ. of Texas M. D. Anderson Cancer Center, 1987.
- ^ LV. Wang and HI. Wu, Biomedical Optics. Wiley. ISBN 978-0-471-74304-0, 2007.
- ^ T. Vo-Dinh, Biomedical Photonics Handbook. Taylor & Francis, Inc. ISBN 0-8493-1116-0, 2002.
- ^ LV. Wang and HI. Wu, Biomedical Optics. Wiley. ISBN 978-0-471-74304-0, 2007.
- ^ S. Jacques, C. Newman, D. Levy, and A. von Eschenbach. Univ. of Texas M. D. Anderson Cancer Center, 1987.
- ^ S. Srinivasan, B. Pogue, S. Jiang, H. Dehghani, C. Kogel, S. Soho, J. Gibson, T. Tosteson, S. Poplack, and K. Paulsen, K D 2003, Proc Natl Acad. Sci. USA 100 12349 54.
- ^ S. Nioka, S. Wen, J. Zhang, J. Du, X. Intes, Z. Zhao, and B. Chance, Simulation study of breast tissue hemodynamics during pressure perturbation. Oxygen Transport to Tissue XXVI 566, 17–22, 2006.