
KNOWPIA
WELCOME TO KNOWPIA

Nkangala District Municipality 
Summary
Nkangala is one of the 3 districts of Mpumalanga province of South Africa. The seat of Nkangala is Middelburg. The Nkangala District Municipality consists of 160 towns and villages. The most spoken language of its 1,308,129 people is IsiNdebele with 28.4%, closely followed by Zulu speakers (2011 Census). The district code is DC31.
Nkangala | |
|---|---|
 Seal | |
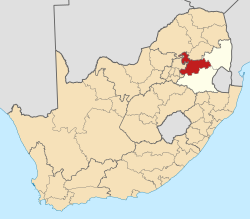 Location in South Africa | |
| Coordinates: 25°45′S 29°25′E / 25.750°S 29.417°E | |
| Country | South Africa |
| Province | Mpumalanga |
| Seat | Middelburg |
| Local municipalities | |
| Government | |
| • Type | Municipal council |
| • Mayor | Speedy Mashilo (ANC) |
| Area | |
| • Total | 16,758 km2 (6,470 sq mi) |
| Population (2011)[2] | |
| • Total | 1,308,129 |
| • Density | 78/km2 (200/sq mi) |
| Racial makeup (2011) | |
| • Black African | 87.9% |
| • Coloured | 1.1% |
| • Indian/Asian | 0.7% |
| • White | 9.9% |
| First languages (2011) | |
| • Southern Ndebele | 28.4% |
| • Zulu | 23.1% |
| • Northern Sotho | 14.7% |
| • Afrikaans | 10.0% |
| • Other | 23.8% |
| Time zone | UTC+2 (SAST) |
| Municipal code | DC31 |
Geography edit
Neighbours edit
Nkangala is surrounded by:
- Sekhukhune (CBDC3) to the north
- Ehlanzeni (DC32) to the north-east
- Gert Sibande (DC30) to the south
- Sedibeng (DC42) to the south-west
- Ekurhuleni (EastRand) to the south-west
- City of Tshwane to the west
- Waterberg (DC36) to the north-west
Local municipalities edit
The district contains the following local municipalities:
| Local municipality | Population | % | Capital town | Dominant language |
|---|---|---|---|---|
| Emalahleni | 276 414 | 27.08% | Witbank | Zulu |
| Thembisile Hani | 258 878 | 25.37% | Kwaggafontein | Southern Ndebele |
| Dr JS Moroka | 243 308 | 23.84% | Siyabuswa | Southern Ndebele, Northern Sotho |
| Steve Tshwete | 142 777 | 13.99% | Middelburg | Zulu |
| Victor Khanye | 56 205 | 5.51% | Delmas | Southern Ndebele, Zulu |
| Emakhazeni | 43 008 | 4.21% | Belfast | Swazi |
Demographics edit
The following statistics are from the 2001 census.
| Language | Population | % |
|---|---|---|
| IsiNdebele | 319 920 | 31.35% |
| IsiZulu | 232 228 | 22.75% |
| Sepedi | 161 338 | 15.81% |
| Afrikaans | 75 294 | 7.38% |
| SiSwati | 56 496 | 5.54% |
| Setswana | 56 144 | 5.50% |
| Sesotho | 42 474 | 4.16% |
| Xitsonga | 31 624 | 3.10% |
| IsiXhosa | 21 199 | 2.08% |
| English | 17 705 | 1.73% |
| Other | 3 514 | 0.34% |
| Tshivenda | 2 654 | 0.26% |
Gender edit
| Gender | Population | % |
|---|---|---|
| Female | 529 354 | 51.87% |
| Male | 491 238 | 48.13% |
Ethnic group edit
| Ethnic group | Population | % |
|---|---|---|
| Black African | 930 873 | 91.21% |
| White | 78 292 | 7.67% |
| Coloured | 8 741 | 0.86% |
| Indian/Asian | 2 686 | 0.26% |
Age edit
| Age | Population | % |
|---|---|---|
| 000 - 004 | 108 087 | 10.59% |
| 005 - 009 | 114 037 | 11.17% |
| 010 - 014 | 118 590 | 11.62% |
| 015 - 019 | 118 041 | 11.57% |
| 020 - 024 | 98 429 | 9.64% |
| 025 - 029 | 88 106 | 8.63% |
| 030 - 034 | 74 084 | 7.26% |
| 035 - 039 | 69 442 | 6.80% |
| 040 - 044 | 58 251 | 5.71% |
| 045 - 049 | 47 903 | 4.69% |
| 050 - 054 | 35 359 | 3.46% |
| 055 - 059 | 25 013 | 2.45% |
| 060 - 064 | 20 550 | 2.01% |
| 065 - 069 | 14 314 | 1.40% |
| 070 - 074 | 12 782 | 1.25% |
| 075 - 079 | 7 302 | 0.72% |
| 080 - 084 | 6 344 | 0.62% |
| 085 - 089 | 2 273 | 0.22% |
| 090 - 094 | 1 080 | 0.11% |
| 095 - 099 | 420 | 0.04% |
| 100 plus | 185 | 0.02% |
Politics edit
Election results edit
Election results for Nkangala in the South African general election, 2004.
- Population 18 and over: 608 871 [59.66% of total population]
- Total votes: 389 097 [38.12% of total population]
- Voting % estimate: 63.90% votes as a % of population 18 and over
| Party | Votes | % |
|---|---|---|
| African National Congress | 333 520 | 85.72% |
| Democratic Alliance | 30 234 | 7.77% |
| United Democratic Movement | 4 188 | 1.08% |
| Freedom Front Plus | 3 997 | 1.03% |
| Pan African Congress | 3 704 | 0.95% |
| African Christian Democratic Party | 3 654 | 0.94% |
| Inkhata Freedom Party | 2 431 | 0.62% |
| New National Party | 1 833 | 0.47% |
| Independent Democrats | 1 710 | 0.44% |
| United Christian Democratic Party | 969 | 0.25% |
| Azanian People's Organisation | 819 | 0.21% |
| SOPA | 381 | 0.10% |
| NA | 272 | 0.07% |
| EMSA | 270 | 0.07% |
| UF | 242 | 0.06% |
| CDP | 226 | 0.06% |
| PJC | 222 | 0.06% |
| TOP | 131 | 0.03% |
| Minority Front | 112 | 0.03% |
| NLP | 92 | 0.02% |
| KISS | 90 | 0.02% |
| Total | 389 097 | 100.00% |
References edit
- ^ "Contact list: Executive Mayors". Government Communication & Information System. Archived from the original on 14 July 2010. Retrieved 22 February 2012.
- ^ a b "Statistics by place". Statistics South Africa. Retrieved 27 September 2015.
- ^ "Statistics by place". Statistics South Africa. Retrieved 27 September 2015.
External links edit
- Nkangala DM official website