


Summary
Node graph architecture is a software design structured around the notion of a node graph. Both the source code and the user interface are designed around the editing and composition (or linking) of atomic functional units. Node graphs are a type of visual programming language.

The source code for the software application is organized into atomic functional units called nodes. This is typically done using classes derived from a base class for all nodes. Each node can have inputs and outputs, which are typically also implemented using classes derived from base classes for all inputs and all outputs. Outputs and inputs can refer to each other, typically by holding pointers to instances of other outputs or inputs. When a node executes its functionality, it retrieves its inputs by following the pointers stored in its inputs to retrieve data output by other nodes. The node then executes its operation on these inputs to produce its own outputs. The ability to link nodes together in this way allows complex tasks or problems to be broken down into atomic nodal units that are easier to understand.
The user interface of the software application will often visually display the node graph to the user. This is often accomplished by using the GPU to perform the rendering which is subsequently displayed on the desktop to the user. Common APIs for the GPU are OpenGL and DirectX. Nodes are often drawn as rectangles, and connections between nodes are drawn with lines or splines.
The use of node graph architecture started in the 1960s.[citation needed] Today the use of node graphs has exploded. The fields of graphics, games, and machine learning are the main adopters of this software design with the majority of tools using node graph architecture.[citation needed]
To this day, there is some debate as to the benefits of visual programming and node graph architecture. Advocates highlight how the abstraction that node graphs provide makes the tool easier to use. Critics highlight how visual programming is too restrictive and how they must resort to modifying source code or scripts to accomplish their tasks.
History edit
There is an ongoing effort by Eric Hosick on Twitter to collect snapshots of all node graph user interfaces in most software applications. The effort attempts to document the evolution and explosion of node graph user interfaces starting from their initial roots. This visual history is hosted on a blog page called Visual Programming Languages - Snapshots. Work leading to node graph architectures and visual programming seems to have started in the 1960s, in the area known as "man-machine communications".
In William Robert Sutherland's MIT thesis (1966) "Online Graphical Specification of Procedures", he describes and analyses topics around a 2D pictorial language. This is one of the first investigations in dataflow-based workflows or programs. Since then his thesis has been used as "prior art" in order to quash lawsuits about dataflow ideas today. His work is often thought to have led the way to what is known as computer-aided design (CAD) today.
- A pictorial program is a natural way of expressing parallel processes. The two-dimensional nature of the language helps in visualizing many things happening at once.[1]
- The ease of debugging programs, particularly parallel ones, will be enhanced by a pictorial language form. Being able to attach data probes and to see a program run gives one a grasp of detail that is hard to obtain in any other way.[1]
- A program's execution need not be controlled by the usual explicit sequential flow conventions. The movement of data through a program may determine its operation. A data controlled convention corresponds closely to our intuitive ideas of how a graphical program should operate and also allows parallel programming without explicit flow designations.[1]
In 1969, T. O. Ellis, J. F. Heafner, and W. L. Sibley published a paper concerning a Graphical Input Language (GRAIL). Their work was related to the RAND Tablet which began with research on Sketchpad, a system where users could write computer commands directly on a tablet, conducted by Ivan Sutherland. The GRAIL system used a flowchart-based graphical programming language and could recognize handwritten letters and gestures.[2] Alan Kay has given a number of demos of the GRAIL system, however, he was not involved with the creation of the system.
- Important organizational concepts in the GRAIL system are the sequential flow of control, the hierarchy of subroutines, and the language (flow diagrams) for pictorially relating the organization within the concepts of the first two.[2]
- The sequential nature of control allows the man to envision isolated processes that are adapted to specific functions--which, in turn, allow the organizer to think of the total program in terms of manageable subparts.[2]
- The subroutine hierarchy emphasizes the notion of isolated processes even more strongly.[2]
- Flow diagrams help the man to picture his control options and the relationship between processes by expressing these interrelationships in two dimensions.[2]

Some of the more recent uses of node graph architectures started around 2005. Node graphs in this time frame start to develop paradigms to deal with complexity in the node graph. The complexity arose as the number of nodes and links in the graph increased. One of the main ideas dealing with complexity was the concept of a group or package node which hid nodes inside of itself, only exposing the inputs and outputs of the group.
- Katana, Foundry
- Houdini, SideFX
- Nuke, Foundry
- Mari, Foundry
- Maya, Autodesk
- Blender
- Grasshopper, McNeel & Associates
- Dynamo, Autodesk
Abstraction and Complexity edit
In the paper Hierarchical Small Worlds in Software Architecture[3] author Sergi Valverde argues that most large software systems are built in a modular and hierarchical fashion, and that node graphs can be used to analyze large software systems. Many other software analysis papers often use node graphs to analyze large software systems suggesting that node graphs are good models of the internal structure and operation of the software.[4]
Visual Programming Debate edit
Node graphs are a subset of the broader class of visual programming languages. Node graphs allow you to design programs in a visual and structured way instead of through the authoring of source code. In the film and video game industries node graphs are synonymous with visual programming. There is currently some debate on the power, abstraction, and need of node graphs and visual programming languages.
- Advocates of visual programming generally emphasize how it simplifies programming because it abstracts away many details and only exposes controls that are necessary for their domain.[5] These controls are the parameters on the nodes which control their behavior and the links between nodes.
- Critics of visual programming generally emphasize how it does not offer enough control, and how for more complex tasks it becomes necessary to author source code.[6] However, these more complex tasks often fall outside the intended usage or domain of the node graph.
This remains an active area of debate with new discussions occurring in open forums to this day. The following are a few of the largest discussions to date.
- Discussion on Hacker News, 2014
- Discussion on Hacker News, 2019
- Reddit discussion, 2019
Research studies tend to shed more details on these discussions and highlight more of the advantages and disadvantages of node graphs. They indicate that node graphs and visual programming are easy to understand for new users, but as the users move to more complex tasks they often need to resort to authoring textual source code.[7] Another survey focuses on peoples beliefs on the cognitive effects of visual programming, in which they found that professional programmers are the most skeptical of visual programming.[8] Other studies have shown in psychological experiments that visual programming can have significant positive effects on performance in cognitive tasks.[9]
Node Graph edit

A node graph in the context of software architecture refers to an organization of software functionality into atomic units known as nodes, and where nodes can be connected to each other via links. The manipulation of nodes and links in the node graph can be often be accomplished through a programmable API or through a visual interface by using the mouse. In the diagram above, the node graph appears on the right-hand side.
In modern-day usage, the term "node graph" is an open compound word. However, in older software it was referred to as a "nodegraph", a closed compound word.
- Nodegraph, Valve Software
- Nodegraph, Notch
Node edit
Nodes perform some type of computation. They encapsulate this executable functionality and will often take inputs and produce outputs as a by-product of execution. A simple example is a node that adds two numbers together. The inputs are the two numbers to add and the output is the sum of the two numbers.
Nodes are analogous to mathematical functions of the following form.

where is the node's computation, is a vector of the node's input values and is a vector of the node's output values.


Visually nodes are often represented by rectangles. However, this is not a convention that is followed by all applications. In the diagram above there are three nodes labeled "Video", "Add Star" and "Add Circle".
Node Parameters edit
Nodes often have additional parameters, that define their execution. These parameters are backed by data types in the node's source code.
Mathematically they can be thought of as additional input values to the node's compute function. The only difference is that these values are controlled directly by the user instead of being output by another node as a by-product of its execution. For example, in the simple example above regarding a node that adds two numbers, we can introduce a bias parameter on the node so that the node can add an extra fixed number onto the sum.
Visually the node's parameters are often exposed after the user clicks on the node. This helps to reduce visually cluttering the node graph. In the diagram above we see a parameter window opening up beside the "Add Star" node.
Node Inputs and Outputs edit
Nodes often have inputs and outputs, as discussed above. Inputs and outputs are backed by data types in the node's source code. Inputs and outputs are crucial to storing values before and after the node's execution.
Mathematically the node's inputs and outputs are analogous to input and output values of functions.
where is the node's computation, is a vector of the node's input values and is a vector of the node's output values.
Visually the inputs and outputs of nodes are often represented with circles.
Node Links edit
Links transfer the values stored in data types between different nodes. They are analogous to mathematical composition. For example, if node A is feeding its outputs to node B, this can be represented mathematically as follows.

where and are the operations performed by node B and node A, is a vector of the node A's input values and is a vector of the node B's output values.


Node Types edit
The type of a node indicates which compute operation it will perform when executed. There are often many different node types participating in the node graph. The following are some examples:
- Nuke, a popular visual effects compositing program, includes hundreds of nodes.[10] each performing specific tasks related to compositing.
- Katana, a popular look and lighting software, includes hundreds of nodes.[11] each performing specific tasks related to lighting computer graphics scenes.
- Mari, a popular 3D painting software, includes hundreds of nodes.[12] each performing specific tasks related to 3D painting.
The most important node type for managing complexity is the group node. This node type does not execute software code in the same as other nodes. This node simply groups a subset of connected nodes together and manages the inputs and outputs into or out of the group. This hides complexity inside of the group nodes and limits their coupling with other nodes outside the group. This leads to a hierarchy where smaller graphs are embedded in group nodes. The following are examples of group nodes which are used to group a subset of connected nodes and to help simplify the graph.
User Interface edit
Software applications using node graph architecture will typically expose the node graph visually or graphically to the user, allowing the user to make changes to the node graph. Using the mouse, users will typically be able to:
- create new nodes
- edit parameters on nodes
- connect nodes together
- evaluate the graph up to a certain node
- view the current output values on nodes
With the increasing usage of node graphs, there is currently increased attention on creating user-friendly interfaces. Often these new interfaces are being designed by user interface specialists and graphical designers. The following are some user interfaces designed by artists and designers.
- Node graphs on Dribbble
- Nodes on Dribbble
Directed Acyclic Graphs edit
Many theoretical results from graph theory apply to node graphs, especially with regards to topology. This subject area where Nodes are linked together to form graphs is well studied.
One particular area of concern during node graph evaluation is cycles. When cycles are present in the node graph, the evaluation never ends as nodes are continually executed by following links. To avoid these problems many node graphs architectures restrict themselves to a subset of graphs known as directed acyclic graphs.
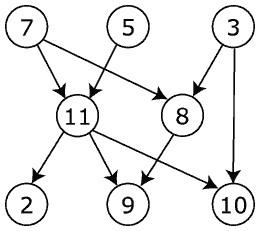
Use in Computer Graphics edit

The use of node graph architecture in software design is especially popular in the film and video game industries. The diagram above shows a simplified user interface for an artistic tool for editing and creating videos. The nodes are represented as rectangles and are connected to each other through curved lines (Bézier curves). In this software's operational model, a video sequence is being passed through the lines onto the next node, and each node performs some additional modifications to the video sequence. In this example one video is translated in 2D, another is pixelated, and finally, both streams are merged.
The following are some examples of software using node graph architecture in the film and video game industries.
- Katana, Foundry
- Houdini, SideFX
- Nuke, Foundry
- Mari, Foundry
- Maya, Autodesk
- Blender
Use in Machine Learning edit
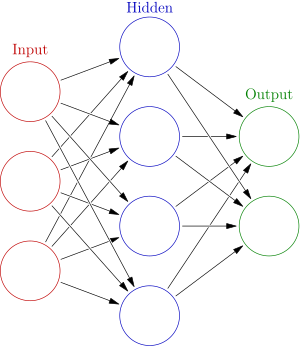
The use of node graph architecture in software design has recently become very popular in machine learning applications. The diagram above shows a simple neural network composed of 3 layers. The 3 layers are the input layer, the hidden layer, and the output layer. The elements in each layer are weights and are connected to weights in other layers. During inference, the machine learning algorithm evaluates the weights in the output layer through a sequence of functional evaluations over the weights from previous layers. During training, the machine learning algorithm uses optimization to minimize a loss function, where the loss function depends on the difference between the weights in the output layer and the expected values. Node graphs are used to visualize, configure and debug these neural network layers.
The following are examples of machine learning software using node graph architecture without a graphical interface for the node graphs.
- PyTorch, GitHub, Facebook
- TensorFlow, GitHub, Google
The following are some examples of machine learning software using node graph architecture.
- Graphbook, Cerbrec
- PerceptiLabs, KDnuggets
- Deep Cognition, Deep Congition Inc
- Neural Network Modeler, IBM
- Neural Network Console, Sony
- Digits, nVIDIA
See also edit
Notes edit
- ^ a b c Sutherland, William Robert (1966). The on-line graphical specification of computer procedures (Thesis). Massachusetts Institute of Technology. hdl:1721.1/13474?show=full.
- ^ a b c d e "GRAIL Graphical Input Language" (PDF).
- ^ Valverde, Sergi; Sole, Ricard V. (11 July 2003). "Hierarchical Small Worlds in Software Architecture". arXiv:cond-mat/0307278.
- ^ "Representation and Analysis of Software". CiteSeerX 10.1.1.394.4865.
{{cite journal}}: Cite journal requires|journal=(help) - ^ "Visual Programming Doesn't Suck".
- ^ "Visual Programming - Why it's a Bad Idea". October 2018.
- ^ "Strengths and weaknesses of a visual programming language in a learning context with children" (PDF).
- ^ "Visual programming: the outlook from academia and industry". 1997. doi:10.1145/266399.266415. S2CID 18983760.
{{cite journal}}: Cite journal requires|journal=(help) - ^ Blackwell, A.F. (1996). "Metacognitive theories of visual programming: what do we think we are doing?". Proceedings 1996 IEEE Symposium on Visual Languages. pp. 240–246. doi:10.1109/VL.1996.545293. ISBN 0-8186-7508-X. S2CID 36822160.
- ^ "Nuke Reference Guide". learn.foundry.com. Retrieved 2020-12-21.
- ^ "Katana Reference Guide". learn.foundry.com. Retrieved 2020-12-21.
- ^ "Mari Reference Guide". learn.foundry.com. Retrieved 2020-12-21.
- ^ "Nuke: Grouping Nodes with the Group Node". learn.foundry.com. Retrieved 2020-12-21.
- ^ "Katana: Grouping Nodes". learn.foundry.com. Retrieved 2020-12-21.
References edit
- Metrics of Software Architecture Changes Based on Structural Distance
- Representation and Analysis of Software
- "Graph Grammars and Constraint Solving for Software Architecture Styles". 1998: 69–72. CiteSeerX 10.1.1.108.9362.
{{cite journal}}: Cite journal requires|journal=(help) - Palsingh, Rishi; Vandana, Vandana (2014). "Application of Graph Theory in Computer Science and Engineering". International Journal of Computer Applications. 104 (1): 1–4. Bibcode:2014IJCA..104a..10P. CiteSeerX 10.1.1.800.2735. doi:10.5120/18165-9025.
- Thorat, Sushrut; Choudhari, Varad (2016). "Implementing a Reverse Dictionary, based on word definitions, using a Node-Graph Architecture" (PDF). arXiv:1606.00025.
{{cite journal}}: Cite journal requires|journal=(help) - "Representation and Analysis of Software". CiteSeerX 10.1.1.394.4865.
{{cite journal}}: Cite journal requires|journal=(help) - A History of Visual Programming: From Basic to Bubble
- Scratch Software
- Blockly Software
- What is visual programming