


Summary
Oldham was a parliamentary constituency centred on the town of Oldham, England. It returned two Members of Parliament (MPs) to the House of Commons of the Parliament of the United Kingdom. The constituency was created by the Great Reform Act of 1832 and was abolished for the 1950 general election when it was split into the Oldham East and Oldham West constituencies.
| Oldham | |
|---|---|
| Former Borough constituency for the House of Commons | |
| 1832–1950 | |
| Seats | two |
| Created from | Lancashire |
| Replaced by | Oldham East and Oldham West |
The Oldham constituency was where Winston Churchill began his political career. Although taking two attempts to succeed, in the 1900 general election Churchill was elected as the member of Parliament for Oldham. He held the constituency for the Conservative Party until he defected from them in defence of free trade in 1904. He then represented the Liberal Party as MP for the seat until the 1906 general election.
Boundaries edit
Though centred on Oldham (the town), the constituency covered a much broader territory; Shaw and Crompton, Royton, Chadderton and Lees all formed part of this district, though these were each granted individual urban district status at a local government level in 1894.
1885–1918: The existing parliamentary borough, and so much of the municipal borough of Oldham as was not already included in the parliamentary borough.[1]
Members of Parliament edit
Notes:-
- a J M Cobbett's political affiliations are complicated.[18] He had stood unsuccessfully on an all-Radical 'plague on both your houses' slate with John Fielden in 1847. He was elected in 1852 as the Radical half of an explicit Radical-Tory alliance.[19] At the 1857 election he was opposed by two Liberals and denied that he had sold out to Palmerston, asserting that the Liberal Chief Whip had no confidence in him.[20] In 1865 he stood unsuccessfully in conjunction with a Conservative,[21] opposed by two Liberals. Nonetheless, from 1852 to 1865 outside Oldham he was generally taken to be a Liberal. From 1872 to his death in 1877 he sat as a Conservative (but one calling for annual Parliaments and manhood suffrage)[22]
- b Churchill changed his party allegiance in April 1904.
- c Denniss changed his surname to Bartley-Denniss, when he was knighted in 1922.
Elections edit
Elections in the 1830s edit
| Party | Candidate | Votes | % | ||
|---|---|---|---|---|---|
| Radical | 677 | 43.0 | |||
| Radical | 645 | 40.9 | |||
| Whig | Benjamin Heywood Bright[24] | 150 | 9.5 | ||
| Tory | William Burge | 101 | 6.4 | ||
| Whig | George Stephen | 3 | 0.2 | ||
| Majority | 495 | 31.4 | |||
| Turnout | 848 | 75.0 | |||
| Registered electors | 1,131 | ||||
| Radical win (new seat) | |||||
| Radical win (new seat) | |||||
| Party | Candidate | Votes | % | ||
|---|---|---|---|---|---|
| Radical | Unopposed | ||||
| Radical | Unopposed | ||||
| Registered electors | 1,029 | ||||
| Radical hold | |||||
| Radical hold | |||||
Cobbett's death caused a by-election.
| Party | Candidate | Votes | % | ||
|---|---|---|---|---|---|
| Conservative | 394 | 48.7 | |||
| Radical | John Morgan Cobbett | 381 | 47.1 | ||
| Radical | Feargus O'Connor | 34 | 4.2 | ||
| Majority | 13 | 1.6 | |||
| Turnout | 809 | 78.6 | |||
| Registered electors | 1,029 | ||||
| Conservative gain from Radical | |||||
| Party | Candidate | Votes | % | ||
|---|---|---|---|---|---|
| Radical | 545 | 32.4 | |||
| Radical | 541 | 32.2 | |||
| Conservative | Joseph Jones | 315 | 18.8 | ||
| Conservative | John Frederick Lees | 279 | 16.6 | ||
| Majority | 226 | 13.4 | |||
| Turnout | 859 | 62.6 | |||
| Registered electors | 1,372 | ||||
| Radical hold | |||||
| Radical hold | |||||
Elections in the 1840s edit
| Party | Candidate | Votes | % | ±% | |
|---|---|---|---|---|---|
| Radical | Unopposed | ||||
| Radical | Unopposed | ||||
| Registered electors | 1,467 | ||||
| Radical hold | |||||
| Radical hold | |||||
| Party | Candidate | Votes | % | ±% | |
|---|---|---|---|---|---|
| Radical | 726 | 27.3 | N/A | ||
| Peelite | 696 | 26.2 | New | ||
| Radical | John Morgan Cobbett | 624 | 23.5 | N/A | |
| Radical | John Fielden | 612 | 23.0 | N/A | |
| Turnout | 1,329 (est) | 78.6 (est) | N/A | ||
| Registered electors | 1,691 | ||||
| Majority | 30 | 1.1 | N/A | ||
| Radical hold | Swing | N/A | |||
| Majority | 84 | 3.2 | N/A | ||
| Peelite gain from Radical | Swing | N/A | |||
Elections in the 1850s edit
| Party | Candidate | Votes | % | ±% | |
|---|---|---|---|---|---|
| Radical | 957 | 36.8 | +13.3 | ||
| Peelite | 868 | 33.4 | +7.2 | ||
| Radical | William Johnson Fox | 777 | 29.9 | +2.6 | |
| Turnout | 1,301 (est) | 68.8 (est) | −9.8 | ||
| Registered electors | 1,890 | ||||
| Majority | 89 | 3.4 | +2.3 | ||
| Radical hold | Swing | +4.9 | |||
| Majority | 91 | 3.5 | +0.3 | ||
| Peelite hold | Swing | −11.6 | |||
Duncuft's death caused a by-election.
| Party | Candidate | Votes | % | ±% | |
|---|---|---|---|---|---|
| Radical | 895 | 53.3 | −13.4 | ||
| Conservative | James Heald[25] | 783 | 46.7 | +13.3 | |
| Majority | 112 | 6.6 | N/A | ||
| Turnout | 1,678 | 84.8 | +16.0 | ||
| Registered electors | 1,978 | ||||
| Radical gain from Peelite | Swing | −13.3 | |||
| Party | Candidate | Votes | % | ±% | |
|---|---|---|---|---|---|
| Radical | 949 | 34.1 | −2.7 | ||
| Radical | 934 | 33.6 | N/A | ||
| Radical | William Johnson Fox | 898 | 32.3 | +2.4 | |
| Majority | 36 | 1.3 | −2.1 | ||
| Turnout | 1,391 (est) | 66.3 (est) | −2.5 | ||
| Registered electors | 2,098 | ||||
| Radical hold | Swing | N/A | |||
| Radical gain from Peelite | Swing | N/A | |||
Platt's death caused a by-election.
| Party | Candidate | Votes | % | ±% | |
|---|---|---|---|---|---|
| Radical | William Johnson Fox | Unopposed | |||
| Radical hold | |||||
| Party | Candidate | Votes | % | ±% | |
|---|---|---|---|---|---|
| Liberal | 1,039 | 35.1 | +2.8 | ||
| Liberal | 966 | 32.6 | −1.5 | ||
| Liberal | J. T. Hibbert | 955 | 32.3 | N/A | |
| Majority | 11 | 0.3 | −1.0 | ||
| Turnout | 1,480 (est) | 68.8 (est) | +2.5 | ||
| Registered electors | 2,151 | ||||
| Liberal hold | Swing | N/A | |||
| Liberal hold | Swing | N/A | |||
Elections in the 1860s edit
Fox's resignation caused a by-election.
| Party | Candidate | Votes | % | ±% | |
|---|---|---|---|---|---|
| Liberal | Unopposed | ||||
| Liberal hold | |||||
| Party | Candidate | Votes | % | ±% | |
|---|---|---|---|---|---|
| Liberal | 1,104 | 28.1 | −4.2 | ||
| Liberal | 1,075 | 27.4 | N/A | ||
| Liberal | John Morgan Cobbett | 899 | 22.9 | −9.7 | |
| Conservative | Frederick Spinks | 846 | 21.6 | New | |
| Majority | 176 | 4.5 | +4.2 | ||
| Turnout | 1,962 (est) | 85.9 (est) | +17.1 | ||
| Registered electors | 2,285 | ||||
| Liberal hold | Swing | ||||
| Liberal hold | Swing | ||||
| Party | Candidate | Votes | % | ±% | |
|---|---|---|---|---|---|
| Liberal | 6,140 | 25.1 | −3.0 | ||
| Liberal | 6,122 | 25.0 | −2.4 | ||
| Conservative | John Morgan Cobbett | 6,116 | 25.0 | +2.1 | |
| Conservative | Frederick Spinks | 6,084 | 24.9 | +3.3 | |
| Majority | 6 | 0.0 | −4.5 | ||
| Turnout | 12,231 (est) | 90.9 (est) | +5.0 | ||
| Registered electors | 13,454 | ||||
| Liberal hold | Swing | −2.9 | |||
| Liberal hold | Swing | −2.6 | |||
Elections in the 1870s edit
Platt's death caused a by-election.
| Party | Candidate | Votes | % | ±% | |
|---|---|---|---|---|---|
| Conservative | 7,278 | 51.0 | +1.1 | ||
| Liberal | Edward Stanley | 6,984 | 49.0 | −1.1 | |
| Majority | 294 | 2.0 | N/A | ||
| Turnout | 14,262 | 88.8 | −2.1 | ||
| Registered electors | 16,063 | ||||
| Conservative gain from Liberal | Swing | +1.1 | |||
| Party | Candidate | Votes | % | ±% | |
|---|---|---|---|---|---|
| Conservative | 8,582 | 25.3 | +0.4 | ||
| Conservative | 8,541 | 25.2 | +0.2 | ||
| Liberal | J. T. Hibbert | 8,397 | 24.8 | -0.3 | |
| Liberal | Edward Stanley | 8,360 | 24.7 | -0.3 | |
| Majority | 222 | 1.6 | N/A | ||
| Majority | 144 | 0.4 | N/A | ||
| Turnout | 16,940 (est) | 91.3 (est) | +0.4 | ||
| Registered electors | 18,560 | ||||
| Conservative gain from Liberal | Swing | +0.4 | |||
| Conservative gain from Liberal | Swing | +0.3 | |||
Cobbett's death caused a by-election.
| Party | Candidate | Votes | % | ±% | |
|---|---|---|---|---|---|
| Liberal | 9,542 | 51.9 | +2.4 | ||
| Conservative | Thomas Evans Lees[26] | 8,831 | 48.1 | -2.4 | |
| Majority | 711 | 3.8 | N/A | ||
| Turnout | 18,373 | 90.7 | -0.6 | ||
| Registered electors | 20,249 | ||||
| Liberal gain from Conservative | Swing | +2.4 | |||
Elections in the 1880s edit
| Party | Candidate | Votes | % | ±% | |
|---|---|---|---|---|---|
| Liberal | 10,630 | 27.5 | +2.7 | ||
| Liberal | 10,409 | 27.0 | +2.3 | ||
| Conservative | Frederick Spinks | 8,982 | 23.3 | −2.0 | |
| Conservative | Smith Taylor-Whitehead[27] | 8,593 | 22.3 | −2.9 | |
| Majority | 2,037 | 5.2 | N/A | ||
| Majority | 1,427 | 3.7 | N/A | ||
| Turnout | 19,307 (est) | 91.6 (est) | +0.3 | ||
| Registered electors | 21,084 | ||||
| Liberal gain from Conservative | Swing | +2.4 | |||
| Liberal gain from Conservative | Swing | +2.6 | |||
| Party | Candidate | Votes | % | ±% | |
|---|---|---|---|---|---|
| Liberal | 12,259 | 25.7 | −1.8 | ||
| Conservative | 11,992 | 25.2 | +1.9 | ||
| Liberal | Edward Stanley | 11,847 | 24.9 | −2.1 | |
| Conservative | Smith Taylor-Whitehead[27] | 11,491 | 24.9 | +1.9 | |
| Turnout | 24,016 | 93.8 | +2.2 (est) | ||
| Registered electors | 25,600 | ||||
| Majority | 768 | 1.5 | −2.2 | ||
| Liberal hold | Swing | −1.9 | |||
| Majority | 145 | 0.3 | N/A | ||
| Conservative gain from Liberal | Swing | +2.0 | |||

| Party | Candidate | Votes | % | ±% | |
|---|---|---|---|---|---|
| Conservative | 11,606 | 25.8 | +0.6 | ||
| Conservative | 11,484 | 25.6 | +1.4 | ||
| Liberal | J. T. Hibbert | 10,921 | 24.3 | −1.4 | |
| Liberal | Joshua Cheetham | 10,891 | 24.3 | −0.6 | |
| Majority | 563 | 1.3 | N/A | ||
| Turnout | 22,608 | 88.3 | −5.5 | ||
| Registered electors | 25,600 | ||||
| Conservative hold | Swing | +0.6 | |||
| Conservative gain from Liberal | Swing | +1.4 | |||
Elections in the 1890s edit
| Party | Candidate | Votes | % | ±% | |
|---|---|---|---|---|---|
| Liberal | 12,619 | 25.6 | +1.3 | ||
| Liberal | 12,541 | 25.4 | +1.1 | ||
| Conservative | Elliot Lees | 12,205 | 24.7 | −0.8 | |
| Conservative | James Mackenzie Maclean | 11,952 | 24.2 | −1.6 | |
| Majority | 677 | 1.4 | N/A | ||
| Majority | 336 | 0.7 | N/A | ||
| Turnout | 24,857 (est) | 89.0 | +0.7 | ||
| Registered electors | 27,929 | ||||
| Liberal gain from Conservative | Swing | +1.1 | |||
| Liberal gain from Conservative | Swing | +1.4 | |||


| Party | Candidate | Votes | % | ±% | |
|---|---|---|---|---|---|
| Conservative | 13,085 | 26.2 | +1.5 | ||
| Conservative | 12,465 | 25.0 | +0.8 | ||
| Liberal | Adam Lee | 12,249 | 24.6 | −1.0 | |
| Liberal | J. T. Hibbert | 12,092 | 24.2 | −1.2 | |
| Majority | 993 | 2.0 | N/A | ||
| Majority | 216 | 0.4 | N/A | ||
| Turnout | 25,185 (est) | 87.5 | −1.5 | ||
| Registered electors | 28,783 | ||||
| Conservative gain from Liberal | Swing | +1.2 | |||
| Conservative gain from Liberal | Swing | +1.0 | |||
Ascroft’s death and Oswald's resignation caused a by-election.


| Party | Candidate | Votes | % | ±% | |
|---|---|---|---|---|---|
| Liberal | 12,976 | 26.7 | +2.1 | ||
| Liberal | 12,770 | 26.2 | +2.0 | ||
| Conservative | Winston Churchill | 11,477 | 23.6 | −2.6 | |
| Conservative | James Mawdsley | 11,449 | 23.5 | −1.5 | |
| Majority | 1,527 | 3.2 | N/A | ||
| Majority | 1,293 | 2.6 | N/A | ||
| Turnout | 24,546 (est) | 86.2 | −1.3 | ||
| Registered electors | 28,476 | ||||
| Liberal gain from Conservative | Swing | +2.4 | |||
| Liberal gain from Conservative | Swing | +1.8 | |||
Elections in the 1900s edit
| Party | Candidate | Votes | % | ±% | |
|---|---|---|---|---|---|
| Liberal | 12,947 | 25.3 | +0.7 | ||
| Conservative | 12,931 | 25.3 | −0.9 | ||
| Liberal | Walter Runciman | 12,709 | 24.9 | +0.7 | |
| Conservative | Charles Birch Crisp | 12,522 | 24.5 | −0.5 | |
| Turnout | 51,109 | 87.9 | +0.4 | ||
| Registered electors | 29,253 | ||||
| Majority | 425 | 0.8 | N/A | ||
| Liberal gain from Conservative | Swing | +0.6 | |||
| Majority | 222 | 0.4 | 0.0 | ||
| Conservative hold | Swing | −0.8 | |||
| Party | Candidate | Votes | % | ±% | |
|---|---|---|---|---|---|
| Liberal | 17,397 | 30.3 | +5.0 | ||
| Liberal | 16,672 | 29.0 | +4.1 | ||
| Conservative | Charles Birch Crisp | 11,989 | 20.9 | −3.6 | |
| Conservative | E. L. Hartley | 11,391 | 19.8 | −5.5 | |
| Turnout | 57,449 | 89.3 | +1.4 | ||
| Registered electors | 32,387 | ||||
| Majority | 4,683 | 8.1 | N/A | ||
| Liberal hold | Swing | +4.3 | |||
| Liberal gain from Conservative | Swing | +3.9 | |||
Elections in the 1910s edit
| Party | Candidate | Votes | % | ±% | |
|---|---|---|---|---|---|
| Liberal | 19,252 | 30.0 | −0.3 | ||
| Liberal | 18,840 | 29.4 | +0.4 | ||
| Conservative | Joseph Hilton | 13,462 | 21.0 | +0.1 | |
| Conservative | Sidney Stott | 12,577 | 19.6 | −0.2 | |
| Majority | 5,378 | 8.4 | +0.3 | ||
| Turnout | 64,131 | 91.8 | +2.5 | ||
| Registered electors | 35,315 | ||||
| Liberal hold | Swing | −0.2 | |||
| Liberal hold | Swing | +0.2 | |||
| Party | Candidate | Votes | % | ±% | |
|---|---|---|---|---|---|
| Liberal | 17,108 | 28.1 | −1.9 | ||
| Liberal | 16,941 | 27.9 | −1.5 | ||
| Conservative | Arthur Edward Wrigley | 13,440 | 22.1 | +1.1 | |
| Conservative | Edmund Bartley-Denniss | 13,281 | 21.9 | +2.3 | |
| Majority | 3,501 | 5.8 | −2.6 | ||
| Turnout | 60,770 | 86.8 | −5.0 | ||
| Registered electors | 35,315 | ||||
| Liberal hold | Swing | −1.5 | |||
| Liberal hold | Swing | −1.3 | |||

| Party | Candidate | Votes | % | ±% | |
|---|---|---|---|---|---|
| Conservative | 12,255 | 40.4 | −3.6 | ||
| Liberal | Arthur Stanley | 10,623 | 35.0 | −21.0 | |
| Labour | William C. Robinson | 7,448 | 24.6 | New | |
| Majority | 1,632 | 5.4 | N/A | ||
| Turnout | 30,326 | 85.1 | −1.7 | ||
| Registered electors | 35,626 | ||||
| Conservative gain from Liberal | Swing | +8.7 | |||
General Election 1914–15:
Another General Election was required to take place before the end of 1915. The political parties had been making preparations for an election to take place and by the July 1914, the following candidates had been selected;
- Liberal: W. H. Sumnervell
- Unionist: John Radcliffe Platt, Edmund Bartley-Denniss
- Labour: William C. Robinson

| Party | Candidate | Votes | % | ±% | |
|---|---|---|---|---|---|
| C | Unionist | 26,568 | 34.3 | +12.4 | |
| C | Liberal | 26,254 | 34.0 | +6.1 | |
| Labour | William C. Robinson | 15,178 | 19.6 | N/A | |
| Liberal | Walter Rea | 9,323 | 12.1 | −16.0 | |
| Turnout | 77,323 | 54.2 | −32.6 | ||
| Registered electors | 71,378 | ||||
| Majority | 17,245 | 22.2 | N/A | ||
| Unionist gain from Liberal | Swing | +14.2 | |||
| Majority | 11,076 | 14.4 | +8.6 | ||
| Liberal hold | Swing | ||||
| C indicates candidate endorsed by the coalition government. | |||||
Elections in the 1920s edit

| Party | Candidate | Votes | % | ±% | |
|---|---|---|---|---|---|
| National Liberal | 24,762 | 28.0 | N/A | ||
| Labour | 24,434 | 27.7 | +8.1 | ||
| Unionist | Samuel Smethurst | 23,200 | 26.2 | −8.1 | |
| Liberal | William Tudor Davies | 9,812 | 11.1 | −22.9 | |
| Liberal | Mary Emmott | 6,186 | 7.0 | −5.1 | |
| Turnout | 88,394 | 62.6 | +8.4 | ||
| National Liberal gain from Liberal | Swing | N/A | |||
| Majority | 14,950 | 16.7 | N/A | ||
| Labour gain from Unionist | Swing | +8.1 | |||
| Majority | 1,234 | 1.5 | N/A | ||
| Party | Candidate | Votes | % | ±% | |
|---|---|---|---|---|---|
| Labour | 20,939 | 23.4 | -4.3 | ||
| Liberal | 20,681 | 23.2 | -4.8 | ||
| Liberal | William Wiggins | 17,990 | 20.1 | +9.0 | |
| Unionist | W.E. Freeman | 15,819 | 17.7 | N/A | |
| Unionist | Samuel Smethurst | 13,894 | 15.6 | -10.6 | |
| Majority | 2,949 | 3.3 | +1.8 | ||
| Majority | 4,862 | 5.5 | -11.2 | ||
| Turnout | 89,323 | 76.3 | +13.7 | ||
| Labour hold | Swing | ||||
| Liberal hold | Swing | ||||
| Party | Candidate | Votes | % | ±% | |
|---|---|---|---|---|---|
| Unionist | 37,419 | 31.2 | |||
| Liberal | 36,761 | 30.7 | |||
| Labour | William Tout | 23,623 | 19.7 | ||
| Labour | James Wilson | 22,081 | 18.4 | ||
| Majority | 13,796 | 11.5 | N/A | ||
| Turnout | 119,884 | ||||
| Liberal hold | Swing | ||||
| Unionist gain from Labour | Swing | ||||
| Party | Candidate | Votes | % | ±% | |
|---|---|---|---|---|---|
| Liberal | 26,325 | 54.8 | +24.1 | ||
| Labour | William Tout | 21,702 | 45.2 | +25.5 | |
| Majority | 4,623 | 9.6 | -1.4 | ||
| Turnout | 48,027 | ||||
| Liberal hold | Swing | ||||
| Party | Candidate | Votes | % | ±% | |
|---|---|---|---|---|---|
| Labour | 34,223 | 26.2 | +6.5 | ||
| Labour | 32,727 | 25.0 | +6.6 | ||
| Unionist | Duff Cooper | 29,424 | 22.5 | -8.7 | |
| Liberal | John Dodd | 20,810 | 15.9 | -14.8 | |
| Liberal | George James Jenkins | 13,528 | 10.4 | N/A | |
| Majority | 13,413 | 10.3 | N/A | ||
| Majority | 3,303 | 2.5 | N/A | ||
| Turnout | 130,712 | 81.2 | |||
| Labour gain from Liberal | Swing | ||||
| Labour gain from Unionist | Swing | ||||
Elections in the 1930s edit
| Party | Candidate | Votes | % | ±% | |
|---|---|---|---|---|---|
| Conservative | 50,693 | 32.5 | |||
| Conservative | 50,395 | 32.3 | |||
| Labour | Gordon Lang | 28,629 | 18.3 | ||
| Labour | James Wilson | 26,361 | 16.9 | ||
| Majority | 21,766 | 14.2 | N/A | ||
| Majority | 24,034 | 15.4 | N/A | ||
| Turnout | 156,348 | ||||
| Conservative gain from Labour | Swing | ||||
| Conservative gain from Labour | Swing | ||||
| Party | Candidate | Votes | % | ±% | |
|---|---|---|---|---|---|
| Conservative | 36,738 | 25.51 | |||
| National Liberal | 34,755 | 24.13 | |||
| Labour | Gordon Lang | 34,316 | 23.83 | ||
| Labour | Matthew Burrow Farr | 29,647 | 20.58 | ||
| Liberal | William Gretton Ward | 8,534 | 5.92 | ||
| Majority | 1,983 | 1.68 | -12.5 | ||
| Turnout | 143,990 | ||||
| Conservative hold | Swing | ||||
| National Liberal gain from Conservative | Swing | ||||
General Election 1939–40
Another General Election was required to take place before the end of 1940. The political parties had been making preparations for an election to take place and by the Autumn of 1939, the following candidates had been selected;
- Conservative: Hamilton Kerr
- Liberal National: John Dodd
- Labour: Leslie Hale, D A Mainds[37]
- Liberal: James Taylor Middleton[38]
Elections in the 1940s edit
| Party | Candidate | Votes | % | ±% | |
|---|---|---|---|---|---|
| Labour | 31,704 | 23.9 | |||
| Labour | 31,327 | 23.6 | |||
| Conservative | Hamilton Kerr | 26,911 | 20.3 | ||
| National Liberal | John Dodd | 24,199 | 18.2 | ||
| Liberal | James Taylor Middleton | 10,365 | 7.8 | ||
| Liberal | Thomas Donald Farrell Powell | 8,264 | 6.2 | ||
| Majority | 7,505 | 5.7 | N/A | ||
| Majority | 4,416 | 3.3 | N/A | ||
| Turnout | 132,770 | 74.6 | |||
| Labour gain from National Liberal | Swing | ||||
| Labour gain from Conservative | Swing | ||||
References edit
- ^ "Chap. 23. Redistribution of Seats Act, 1885". The Public General Acts of the United Kingdom passed in the forty-eighth and forty-ninth years of the reign of Queen Victoria. London: Eyre and Spottiswoode. 1885. pp. 111–198.
- ^ a b Leigh Rayment's Historical List of MPs – Constituencies beginning with "O"
- ^ a b c d e f Rix, Kathryn (21 July 2015). "A rather pale copy of the original: John Morgan Cobbett (1800–1877)". The Victorian Commons. Retrieved 10 June 2018.
- ^ a b c d e f g h Stooks Smith, Henry. (1973) [1844-1850]. Craig, F. W. S. (ed.). The Parliaments of England (2nd ed.). Chichester: Parliamentary Research Services. p. 185. ISBN 0-900178-13-2.
- ^ a b Churton, Edward (1838). The Assembled Commons or Parliamentary Biographer: 1838. pp. 90, 134. Retrieved 27 November 2018 – via Google Books.
- ^ The Editors of Encyclopaedia Britannica. "John Fielden". Encyclopaedia Britannica. Retrieved 27 November 2018.
- ^ "an ultra-Radical of Cobbettite opinions" - "Oldham". Manchester Times. 29 July 1837. p. 3.
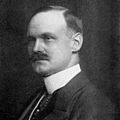
- ^ a b c "William Johnson Fox (1786–1864), Religious and political orator, journalist and Liberal politician; MP for Oldham". National Portrait Gallery. Retrieved 10 June 2018.
- ^ a b c Rudy, Jason R. (2009). Electric meters: Victorian physiological poetics. Athens, Ohio: Ohio University Press. p. 47. ISBN 978-0-8214-1882-6. Retrieved 10 June 2018.
- ^ a b c "Oldham". Leeds Times. 7 August 1847. p. 7. Retrieved 10 June 2018 – via British Newspaper Archive.
- ^ a b Dod, Charles Roger; Dod, Robert Phipps (1847). Dod's Parliamentary Companion, Volume 15. Dod's Parliamentary Companion. p. 169. Retrieved 27 November 2018 – via Google Books.
- ^ "The Elections". London Evening Standard. 2 July 1852. pp. 3–4. Retrieved 10 June 2018 – via British Newspaper Archive.
- ^ The Reasoner, Volumes 2-3. 1847. p. 461. Retrieved 10 June 2018.
- ^ "The Country". The Spectator. 11 July 1835. p. 7. Retrieved 10 June 2018.
- ^ "Electioneering Prospects in Lancashire". Newcastle Guardian and Tyne Mercury. 3 July 1852. p. 2. Retrieved 10 June 2018 – via British Newspaper Archive.
- ^ Rix, Kathryn (27 August 2015). "MP of the Month: the untimely death of James Platt, MP for Oldham (1823–57)". The Victorian Commons. Retrieved 10 June 2018.
- ^ "The General Election". Lloyd's Weekly Newspaper. 15 March 1857. p. 2. Retrieved 10 June 2018 – via British Newspaper Archive.
- ^ "Death of Mr J M Cobbett MP for Oldham". Manchester Courier and Lancashire General Advertiser. 15 February 1877.
- ^ "The Elections". Manchester Courier and Lancashire General Advertiser. 10 July 1852.
- ^ "The General Election". Morning Post. 30 March 1857.
- ^ "Oldham Election". Manchester Courier and Lancashire General Advertiser. 24 June 1865.
- ^ "Death of Mr Cobbett MP". Pall Mall Gazette. 14 February 1877.
- ^ a b c d e f g h i j k l m n o p q r Craig, F. W. S., ed. (1977). British Parliamentary Election Results 1832-1885 (e-book) (1st ed.). London: Macmillan Press. ISBN 978-1-349-02349-3.
- ^ "8 December 1832". Sun. p. 3. Retrieved 20 April 2020 – via British Newspaper Archive.
- ^ "The Oldham Election". The Daily News. 3 December 1852. p. 5. Retrieved 14 June 2018 – via British Newspaper Archive.
- ^ "Election Intelligence". Western Mail. 26 February 1877. p. 3. Retrieved 26 January 2018.
- ^ a b "The Conservative Candidates for Oldham". Manchester Courier and Lancashire General Advertiser. 22 November 1882. p. 8. Retrieved 6 December 2017 – via British Newspaper Archive.
- ^ a b Liberal Year Book (1889), p.217
- ^ a b c d e f Craig, FWS, ed. (1974). British Parliamentary Election Results: 1885-1918. London: Macmillan Press. ISBN 9781349022984.
- ^ a b The Liberal Yearbook (1917), p.316
- ^ a b c d P. F. Clarke, Lancashire and the New Liberalism, pp. 435–436
- ^ Manchester Guardian, 14 November 1911, p.9
- ^ a b The Liberal Year Book (1923), p.261
- ^ British Parliamentary Election Results 1918-1949, FWS Craig
- ^ a b c d The Constitutional Year Book (1938), p.220
- ^ F. W. S. Craig, British Parliamentary Election Results, 1918–1949; Political Reference Publications, Glasgow, 1949 p211
- ^ Report of the Annual Conference of the Labour Party, 1939
- ^ The Liberal Magazine, 1939
- ^ "Politics Resources". Election 1945. Politics Resources. Archived from the original on 24 September 2015. Retrieved 6 January 2011.
Sources edit
- Boundaries of Parliamentary Constituencies 1885–1972, compiled and edited by F. W. S. Craig (Parliamentary Reference Publications 1972)
- British Parliamentary Election Results 1832–1885, compiled and edited by F.W.S. Craig (The Macmillan Press 1977)
- British Parliamentary Election Results 1885–1918, compiled and edited by F.W.S. Craig (Macmillan Press 1974)
- British Parliamentary Election Results 1918–1949, compiled and edited by F.W.S. Craig (Macmillan Press, revised edition 1977)
- Who's Who of British Members of Parliament: Volume I 1832–1885, edited by M. Stenton (The Harvester Press 1976)
- Who's Who of British Members of Parliament, Volume II 1886–1918, edited by M. Stenton and S. Lees (Harvester Press 1978)
- Who's Who of British Members of Parliament, Volume III 1919–1945, edited by M. Stenton and S. Lees (Harvester Press 1979)
- Who's Who of British Members of Parliament, Volume IV 1945–1979, edited by M. Stenton and S. Lees (Harvester Press 1981)