


Summary
Plotly is a technical computing company headquartered in Montreal, Quebec, that develops online data analytics and visualization tools. Plotly provides online graphing, analytics, and statistics tools for individuals and collaboration, as well as scientific graphing libraries for Python, R, MATLAB, Perl, Julia, Arduino, JavaScript[1] and REST.
| Company type | Private |
|---|---|
| Industry | Computer software |
| Founded | Montreal, Quebec (2012) |
| Founder | Alex Johnson Jack Parmer Chris Parmer Matthew Sundquist |
| Headquarters | |
| Website | plotly |
History edit
Plotly was founded by Alex Johnson, Jack Parmer, Chris Parmer, and Matthew Sundquist.[2]
The founders' backgrounds are in science, energy, and data analysis and visualization.[2] Early employees include Christophe Viau, a Canadian software engineer and Ben Postlethwaite, a Canadian geophysicist.[3] Plotly was named one of the Top 20 Hottest Innovative Companies in Canada by the Canadian Innovation Exchange.[4] Plotly was featured in "startup row" at PyCon 2013,[5] and sponsored the SciPy 2018 conference.[6]
Plotly raised $5.5 million during its Series A funding, led by MHS Capital, Siemens Venture Capital, Rho Ventures, Real Ventures, and Silicon Valley Bank.[7]
The Boston Globe and Washington Post newsrooms have produced data journalism using Plotly.[8][9] In 2020, Plotly was named a Best Place to Work by the Canadian SME National Business Awards, and nominated as Business of the Year.[10]
Products edit
Plotly offers open-source and enterprise products.
- Dash is an open-source Python, R, and Julia framework for building web-based analytic applications. Many specialized open-source Dash libraries exist that are tailored for building domain-specific Dash components and applications. Some examples are Dash DAQ, for building data acquisition GUIs to use with scientific instruments, and Dash Bio, which enables users to build custom chart types, sequence analysis tools, and 3D rendering tools for bioinformatics applications.[11]
- Dash Enterprise is Plotly’s paid product for building, testing, deploying, managing and scaling Dash applications organization-wide.[12]
- Chart Studio Cloud is a free, online tool for creating interactive graphs. It has a point-and-click graphical user interface for importing and analyzing data into a grid and using stats tools.[13] Graphs can be embedded or downloaded.
- Chart Studio Enterprise is a paid product that allows teams to create, style, and share interactive graphs on a single platform. It offers expanded authentication and file export options, and does not limit sharing and viewing.[14]
- Data visualization libraries Plotly.js is an open-source JavaScript library for creating graphs and powers Plotly.py for Python, as well as Plotly.R for R, MATLAB, Node.js, Julia, and Arduino and a REST API.[15][16][17][18][19][20][21] Plotly can also be used to style interactive graphs with Jupyter notebook.[22]
- Figure Converters which convert matplotlib,[23] ggplot2,[24] and IGOR Pro[25] graphs into interactive, online graphs.
Data visualization libraries edit
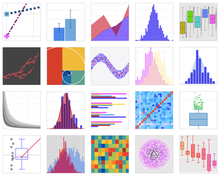
Plotly provides a collection of supported chart types across several programming languages:
| Chart Type | Chart Name | JavaScript[26] | Python[27] | R[28] | Julia[29] |
|---|---|---|---|---|---|
| Basic charts | Scatter plot | TRUE | TRUE | TRUE | TRUE |
| Basic charts | Line chart | TRUE | TRUE | TRUE | TRUE |
| Basic charts | Bar chart | TRUE | TRUE | TRUE | TRUE |
| Basic charts | Pie chart | TRUE | TRUE | TRUE | TRUE |
| Basic charts | Bubble chart | TRUE | TRUE | TRUE | TRUE |
| Basic charts | Dot plot | TRUE | TRUE | TRUE | TRUE |
| Basic charts | Filled area plot | TRUE | TRUE | TRUE | TRUE |
| Basic charts | Horizontal bar chart | TRUE | TRUE | TRUE | TRUE |
| Basic charts | Gantt chart | TRUE | TRUE | ||
| Basic charts | Sunburst chart | TRUE | TRUE | TRUE | TRUE |
| Basic charts | Sankey diagram | TRUE | TRUE | TRUE | TRUE |
| Basic charts | Point cloud | TRUE | TRUE | ||
| Basic charts | Treemap | TRUE | TRUE | TRUE | TRUE |
| Basic charts | Table | TRUE | TRUE | TRUE | TRUE |
| Basic charts | Dumbbell plot | TRUE | |||
| AI and machine learning charts | ML regression | TRUE | |||
| AI and machine learning charts | kNN classification | TRUE | |||
| AI and machine learning charts | ROC and PR curves | TRUE | |||
| AI and machine learning charts | PCA visualization | TRUE | |||
| AI and machine learning charts | t-SNE and UMAP projections | TRUE | |||
| Statistical charts | Box plot | TRUE | TRUE | TRUE | TRUE |
| Statistical charts | Histogram | TRUE | TRUE | TRUE | TRUE |
| Statistical charts | Distplot | TRUE | |||
| Statistical charts | 2D density plot | TRUE | TRUE | ||
| Statistical charts | 2D histogram | TRUE | TRUE | TRUE | TRUE |
| Statistical charts | 2D histogram contour | TRUE | TRUE | TRUE | TRUE |
| Statistical charts | Scatterplot matrix | TRUE | |||
| Statistical charts | Facet and trellis plot | TRUE | |||
| Statistical charts | Tree plot | TRUE | |||
| Statistical charts | SPC control chart | TRUE | TRUE | ||
| Statistical charts | Violin plot | TRUE | TRUE | TRUE | TRUE |
| Statistical charts | Parallel categories diagram | TRUE | TRUE | TRUE | |
| Statistical charts | Splom | TRUE | TRUE | TRUE | |
| Statistical charts | Marginal distribution plot | TRUE | |||
| Statistical charts | Strip chart | TRUE | |||
| Scientific charts | Contour plot | TRUE | TRUE | TRUE | TRUE |
| Scientific charts | Heatmap | TRUE | TRUE | TRUE | TRUE |
| Scientific charts | Imshow | TRUE | |||
| Scientific charts | Ternary plot | TRUE | TRUE | TRUE | TRUE |
| Scientific charts | Parallel coordinates plot | TRUE | TRUE | TRUE | TRUE |
| Scientific charts | Log plot | TRUE | TRUE | TRUE | TRUE |
| Scientific charts | Dendrogram | TRUE | |||
| Scientific charts | Annotated heatmap | TRUE | |||
| Scientific charts | WebGL heatmap | TRUE | TRUE | TRUE | |
| Scientific charts | Wind rose chart | TRUE | TRUE | TRUE | |
| Scientific charts | Ternary contour plot | TRUE | TRUE | TRUE | TRUE |
| Scientific charts | Ternary overlay | TRUE | |||
| Scientific charts | Quiver plot | TRUE | |||
| Scientific charts | Streamline plot | TRUE | |||
| Scientific charts | Network graph | TRUE | TRUE | ||
| Scientific charts | Radar chart | TRUE | TRUE | TRUE | TRUE |
| Scientific charts | Carpet plot | TRUE | TRUE | TRUE | TRUE |
| Scientific charts | Carpet scatter plot | TRUE | TRUE | TRUE | TRUE |
| Scientific charts | Carpet contour plot | TRUE | TRUE | TRUE | TRUE |
| Scientific charts | Polar chart | TRUE | TRUE | TRUE | TRUE |
| Scientific charts | Image data display | TRUE | TRUE | TRUE | |
| Financial charts | Waterfall chart | TRUE | TRUE | TRUE | TRUE |
| Financial charts | Indicator | TRUE | TRUE | TRUE | |
| Financial charts | Candlestick chart | TRUE | TRUE | TRUE | TRUE |
| Financial charts | Funnel chart | TRUE | TRUE | TRUE | TRUE |
| Financial charts | Time series | TRUE | TRUE | TRUE | TRUE |
| Financial charts | OHLC chart | TRUE | TRUE | TRUE | TRUE |
| Financial charts | Gauge chart | TRUE | TRUE | TRUE | TRUE |
| Financial charts | Bullet chart | TRUE | TRUE | TRUE | TRUE |
| Maps | Mapbox map layers | TRUE | TRUE | TRUE | TRUE |
| Maps | Mapbox density heatmap | TRUE | TRUE | TRUE | TRUE |
| Maps | Mapbox choropleth map | TRUE | TRUE | TRUE | TRUE |
| Maps | Choropleth map | TRUE | TRUE | TRUE | TRUE |
| Maps | Lines on maps | TRUE | TRUE | TRUE | TRUE |
| Maps | Lines on Mapbox | TRUE | TRUE | ||
| Maps | Bubble maps | TRUE | TRUE | TRUE | TRUE |
| Maps | Scatter plots on maps | TRUE | TRUE | TRUE | TRUE |
| Maps | Scatter plots on Mapbox | TRUE | TRUE | TRUE | TRUE |
| Maps | Filled area on map | TRUE | TRUE | TRUE | TRUE |
| Maps | Mapbox hexbin | TRUE | |||
| 3D charts | 3D scatter plot | TRUE | TRUE | TRUE | TRUE |
| 3D charts | Ribbon plot | TRUE | TRUE | ||
| 3D charts | 3D surface plot | TRUE | TRUE | TRUE | TRUE |
| 3D charts | 3D mesh plot | TRUE | TRUE | TRUE | TRUE |
| 3D charts | 3D line plot | TRUE | TRUE | TRUE | TRUE |
| 3D charts | Tri-surf plot | TRUE | TRUE | TRUE | TRUE |
| 3D charts | 3D cluster graph | TRUE | TRUE | ||
| 3D charts | 3D cone plot | TRUE | TRUE | TRUE | TRUE |
| 3D charts | 3D streamtube plot | TRUE | TRUE | TRUE | TRUE |
| 3D charts | 3D isosurface plot | TRUE | TRUE | TRUE | TRUE |
| 3D charts | 3D bubble chart | TRUE | |||
| 3D charts | 3D volume plot | TRUE | |||
| Subplots | Subplots | TRUE | TRUE | TRUE | TRUE |
| Multiple Axes | Multiple Axes | TRUE | TRUE | TRUE | TRUE |
Dash edit
Dash is a Python framework built on top of React, a JavaScript library.[30] But Dash also works for R, and most recently supports Julia, and while still described a Python framework, Python isn't used for the other languages, "describing Dash as a Python framework misses a key feature of its design: the Python side (the back end/server) of Dash was built to be lightweight and stateless [allowing] multiple back-end languages to coexist on an equal footing".[31] It is possible to integrate D3.js charts as Dash components.[32] Dash provides the default CSS (and HTML and JavaScript, and you can add your own), but for custom styling Dash applications CSS can be added, or Dash Enterprise used.[33]
Dash Enterprise edit
Dash Enterprise is Plotly’s paid product for building, testing, deploying, managing and scaling Dash applications organization-wide.[34] The product integrates with enterprise IT systems to enable organizations to build, deploy and scale low-code Dash applications.[35] With open-source Dash, analytic applications can be run from a local machine, but cannot be easily accessed by others in the organization.[36]
Enterprise IT integration edit
Dash Enterprise installs on cloud environments and on-premises. Amazon Web Services, Google Cloud Platform, and Microsoft Azure are supported, as are multiple Linux on-premises servers.[37] Authentication integrations include LDAP, AD, PKI, Okta, SAML, OAuth2, SSO, and email authentication, and Dash application access is managed through a GUI rather than code.[38] Dash Enterprise connects to major big data backends, including Salesforce, PostgreSQL, Databricks via PySpark, Snowflake, Dask, Datashader, and Vaex.[39] In 2020, Plotly partnered with NVIDIA to integrate Dash with RAPIDS,[40] and NVIDIA participated in Plotly’s Series C funding round.
Low-code capabilities edit
Dash Enterprise enables low-code development of Dash applications, which is not possible with open-source Dash. Enterprise users can write applications in multiple development environments, including Jupyter Notebook.[41] Dash Enterprise ships with several “development engines” for drag-and-drop application editing, application design, and automated reporting, as well as dozens of artificial intelligence and machine learning application templates.[42][43][44][45]
Deployment and scaling edit
Dash application code is deployed to Dash Enterprise using the git-push command. Dash application deployments are containerized to avoid dependency conflicts, and can be embedded in existing web platforms without iframes.[46][47] Deployed applications can be managed and accessed in a single portal called App Manager, where administrators can control user authentication and view usage analytics.[48][49] Dash Enterprise scales horizontally with Kubernetes.[50] Jobs queuing, GPU acceleration, and CPU parallelization support high performance computing requirements.[51] Plotly also offers professional services for application development and workshop training.
References edit
- ^ "Plotly Javascript". plotly.com. Retrieved 2023-03-29.
- ^ a b Czikk, Joseph (July 29, 2013). "Ex-Silicon Valley kids to launch web startup in Montreal". Montreal Gazette. Archived from the original on 2013-11-13. Retrieved 2013-10-29.
- ^ "About". Plotly. Retrieved 2013-10-29.
- ^ Levy, Carmi (November 11, 2013). "CIX 2013 celebrates Canada's innovation economy". Yahoo! Finance Canada.
- ^ Curtin, Brian (March 11, 2013). "Announcing Our Startup Row Selections". PyCon.
- ^ "Sponsors | SciPy 2018". Retrieved 2018-08-06.
- ^ "Plotly raises $5.5 million Series A from Rho Ventures, MHS Capital, Real Ventures, others". BetaKit. Retrieved 2018-08-06.
- ^ "Where trucks crash on Storrow and Memorial drives - The Boston Globe". BostonGlobe.com. Retrieved 2018-08-06.
- ^ "A hunger expert explains what happens now that food stamps are cut". Washington Post. Retrieved 2018-08-06.
- ^ "Plotly Named Best Place to Work" (Press release). 4 February 2020.
- ^ "Dash by Plotly". Retrieved 2018-07-31.
- ^ "Dash Enterprise". Plotly. Retrieved 2014-09-20.
- ^ Machlis, Sharon (November 6, 2013). "Beauty and brains: Plotly combines dataviz and serious statistical analysis". Computer World. Archived from the original on 2013-12-02. Retrieved 2013-11-07.
- ^ "Chart Studio".
- ^ "Plotly's Julia library". Plotly. Retrieved 2014-10-12.
- ^ "Plotly's Node.js library". Plotly. Retrieved 2014-10-12.
- ^ "Plotly's R Library". Plotly. Retrieved 2014-10-12.
- ^ "Plotly's MATLAB library". Plotly. Retrieved 2014-10-12.
- ^ "Graphical Representations of Data". Python Wiki. November 4, 2013.
- ^ Romano, Zoe (November 4, 2013). "Create Interactive Graphs Logging Arduino Data With Plotly". Arduino Blog.
- ^ "APIs". Plotly. Retrieved 2013-10-29.
- ^ "Plotly IPython gallery". IPython Notebook Viewer. Retrieved 2013-12-10.
- ^ "Online, interactive Matplotlib graphs". Plotly. Retrieved 2014-10-12.
- ^ "Online, interactive ggplot2 graphs". Plotly. Retrieved 2014-10-12.
- ^ "Online, interactive Igor Pro graphs". Plotly. Retrieved 2014-10-12.
- ^ "Plotly JavaScript Graphing Library".
- ^ "Plotly Python Graphing Library".
- ^ "Plotly R Graphing Library".
- ^ "Plotly.jl". GitHub. 14 October 2021.
- ^ "React for Python Developers | Dash for Python Documentation | Plotly".
- ^ plotly (2020-10-26). "Announcing Dash for Julia". Medium. Retrieved 2021-03-19.
- ^ "Integrating D3.js into Dash Components | Dash for Python Documentation | Plotly".
- ^ "Adding CSS & JS and Overriding the Page-Load Template | Dash for Python Documentation | Plotly". dash.plotly.com. Retrieved 2021-03-19.
- ^ https://plotly.com/
- ^ "Dash Overview".
- ^ "Dash". GitHub. 26 October 2021.
- ^ "Dash Enterprise - Easy Installation".
- ^ "No-Code Authentication".
- ^ "Big Data Pipelines".
- ^ "Plotly and NVIDIA Partner to Integrate Dash and RAPIDS". 19 May 2020.
- ^ "Data App Workspaces".
- ^ "Dash AI App Catalogue".
- ^ "Dash Dashboard Engine".
- ^ "Dash Design Kit".
- ^ "Dash Snapshot Engine".
- ^ "Dash Embedding".
- ^ "Dash App Manager".
- ^ "Dash App Manager".
- ^ "Dash App Manager".
- ^ "Dash Kubernetes".
- ^ "High Performance Computing".
External links edit
- Official website