


Summary
Port Mansfield is a census-designated place (CDP) in Willacy County, Texas, United States. The population was 226 at the 2010 census.[3]
Port Mansfield, Texas | |
|---|---|
 | |
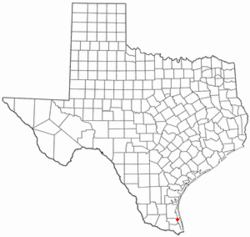 Location of Port Mansfield, Texas | |
 | |
| Coordinates: 26°33′20″N 97°25′52″W / 26.55556°N 97.43111°W | |
| Country | United States |
| State | Texas |
| County | Willacy |
| Area | |
| • Total | 5.7 sq mi (14.8 km2) |
| • Land | 5.2 sq mi (13.5 km2) |
| • Water | 0.5 sq mi (1.3 km2) |
| Elevation | 3 ft (1 m) |
| Population (2010) | |
| • Total | 226 |
| • Density | 40/sq mi (15/km2) |
| Time zone | UTC-6 (Central (CST)) |
| • Summer (DST) | UTC-5 (CDT) |
| ZIP code | 78598 |
| Area code | 956 |
| FIPS code | 48-58928[1] |
| GNIS feature ID | 1344369[2] |
Geography edit
Port Mansfield is located at 26°33′20″N 97°25′52″W / 26.55556°N 97.43111°W (26.555453, -97.431051).[4]
According to the United States Census Bureau, the CDP has a total area of 5.7 square miles (14.8 km2), of which 5.2 square miles (13.5 km2) is land and 0.5 square mile (1.3 km2) (8.76%) is water. A navigational channel connects Port Mansfield to the Intracoastal Waterway, and to the Gulf of Mexico, cutting through Padre Island via the Port Mansfield Channel.
The cut through South Padre Island had shoaled considerably in the early 2000s, and by 2008 only shallow draft boats could safely enter at the Mansfield cut. The channel was dredged in the winter months of 2009-2010 by the United States Army Corps of Engineers, using Federal relief money following hurricanes Rita and Dolly.[5] The channel was dredged in the spring of 2021 and is now[citation needed] 16–20 feet deep, with all the dredge tailings making a beach on the north side of the jetty.
Demographics edit
2020 census edit
| Race | Number | Percentage |
|---|---|---|
| White (NH) | 233 | 73.04% |
| Black or African American (NH) | 1 | 0.31% |
| Some Other Race (NH) | 1 | 0.31% |
| Mixed/Multi-Racial (NH) | 7 | 2.19% |
| Hispanic or Latino | 77 | 24.14% |
| Total | 319 |
As of the 2020 United States census, there were 319 people, 92 households, and 31 families residing in the CDP.
2000 census edit
As of the census[1] of 2000, there were 415 people, 187 households, and 137 families residing in the CDP. The population density was 79.6 inhabitants per square mile (30.7/km2). There were 563 housing units at an average density of 108.0 per square mile (41.7/km2). The racial makeup of the CDP was 93.01% White, 0.96% Native American, 4.58% from other races, and 1.45% from two or more races. Hispanic or Latino of any race were 14.22% of the population.
There were 187 households, out of which 14.4% had children under the age of 18 living with them, 64.7% were married couples living together, 5.3% had a female householder with no husband present, and 26.7% were non-families. 21.4% of all households were made up of individuals, and 9.1% had someone living alone who was 65 years of age or older. The average household size was 2.22 and the average family size was 2.50.
In the CDP, the population was spread out, with 13.5% under the age of 18, 4.6% from 18 to 24, 16.9% from 25 to 44, 37.1% from 45 to 64, and 28.0% who were 65 years of age or older. The median age was 55 years. For every 100 females, there were 102.4 males. For every 100 females age 18 and over, there were 107.5 males.
The median income for a household in the CDP was $26,500, and the median income for a family was $27,500. Males had a median income of $18,333 versus $26,667 for females. The per capita income for the CDP was $15,087. About 20.5% of families and 26.8% of the population were below the poverty line, including 53.5% of those under age 18 and 5.4% of those age 65 or over.
Climate edit
According to the Köppen Climate Classification system, Port Mansfield has a humid subtropical climate, abbreviated "Cfa" on climate maps. The hottest temperature recorded in Port Mansfield was 104 °F (40.0 °C) on May 11, 2006, while the coldest temperature recorded was 15 °F (−9.4 °C) on January 12, 1962 and December 23–24, 1989.[9]
| Climate data for Port Mansfield, Texas, 1991–2020 normals, extremes 1958–present | |||||||||||||
|---|---|---|---|---|---|---|---|---|---|---|---|---|---|
| Month | Jan | Feb | Mar | Apr | May | Jun | Jul | Aug | Sep | Oct | Nov | Dec | Year |
| Record high °F (°C) | 92 (33) |
95 (35) |
101 (38) |
102 (39) |
104 (40) |
103 (39) |
102 (39) |
102 (39) |
102 (39) |
99 (37) |
98 (37) |
91 (33) |
104 (40) |
| Mean maximum °F (°C) | 81.6 (27.6) |
84.1 (28.9) |
87.0 (30.6) |
90.6 (32.6) |
91.3 (32.9) |
93.3 (34.1) |
94.7 (34.8) |
95.0 (35.0) |
94.3 (34.6) |
90.4 (32.4) |
87.4 (30.8) |
83.2 (28.4) |
98.7 (37.1) |
| Mean daily maximum °F (°C) | 67.7 (19.8) |
71.0 (21.7) |
75.6 (24.2) |
80.8 (27.1) |
85.3 (29.6) |
89.6 (32.0) |
90.6 (32.6) |
91.8 (33.2) |
88.5 (31.4) |
84.1 (28.9) |
76.4 (24.7) |
70.3 (21.3) |
81.0 (27.2) |
| Daily mean °F (°C) | 59.0 (15.0) |
62.8 (17.1) |
68.0 (20.0) |
73.6 (23.1) |
79.0 (26.1) |
83.1 (28.4) |
84.1 (28.9) |
84.7 (29.3) |
81.1 (27.3) |
76.0 (24.4) |
68.0 (20.0) |
61.2 (16.2) |
73.4 (23.0) |
| Mean daily minimum °F (°C) | 50.3 (10.2) |
54.5 (12.5) |
60.5 (15.8) |
66.5 (19.2) |
72.7 (22.6) |
76.6 (24.8) |
77.7 (25.4) |
77.5 (25.3) |
73.6 (23.1) |
68.0 (20.0) |
59.6 (15.3) |
52.2 (11.2) |
65.8 (18.8) |
| Mean minimum °F (°C) | 35.4 (1.9) |
37.9 (3.3) |
42.8 (6.0) |
52.6 (11.4) |
60.8 (16.0) |
71.0 (21.7) |
72.9 (22.7) |
72.9 (22.7) |
64.3 (17.9) |
50.8 (10.4) |
42.1 (5.6) |
35.5 (1.9) |
32.0 (0.0) |
| Record low °F (°C) | 15 (−9) |
20 (−7) |
29 (−2) |
38 (3) |
48 (9) |
58 (14) |
65 (18) |
64 (18) |
55 (13) |
32 (0) |
30 (−1) |
15 (−9) |
15 (−9) |
| Average precipitation inches (mm) | 1.13 (29) |
1.75 (44) |
1.33 (34) |
1.41 (36) |
2.39 (61) |
2.00 (51) |
2.39 (61) |
1.15 (29) |
5.37 (136) |
3.10 (79) |
1.98 (50) |
1.25 (32) |
25.25 (642) |
| Average snowfall inches (cm) | 0.0 (0.0) |
0.0 (0.0) |
0.0 (0.0) |
0.0 (0.0) |
0.0 (0.0) |
0.0 (0.0) |
0.0 (0.0) |
0.0 (0.0) |
0.0 (0.0) |
0.0 (0.0) |
0.0 (0.0) |
0.1 (0.25) |
0.1 (0.25) |
| Average precipitation days (≥ 0.01 in) | 6.3 | 5.1 | 4.4 | 3.6 | 4.2 | 4.1 | 3.6 | 2.8 | 8.7 | 5.5 | 4.8 | 5.7 | 58.8 |
| Average snowy days (≥ 0.1 in) | 0.0 | 0.0 | 0.0 | 0.0 | 0.0 | 0.0 | 0.0 | 0.0 | 0.0 | 0.0 | 0.0 | 0.0 | 0.0 |
| Source 1: NOAA[10] | |||||||||||||
| Source 2: National Weather Service[9] | |||||||||||||
Education edit
Port Mansfield is served by the San Perlita Independent School District. In addition, South Texas Independent School District operates magnet schools that serve the community.
References edit
- ^ a b "U.S. Census website". United States Census Bureau. Retrieved January 31, 2008.
- ^ "US Board on Geographic Names". United States Geological Survey. October 25, 2007. Retrieved January 31, 2008.
- ^ "Population and Housing Unit Counts, 2010 Census of Population and Housing" (PDF). Texas: 2010. Retrieved January 5, 2017.
- ^ "US Gazetteer files: 2010, 2000, and 1990". United States Census Bureau. February 12, 2011. Retrieved April 23, 2011.
- ^ "Dredging at Port Mansfield to begin". Corpus Christi Caller-Times. Retrieved May 30, 2010.
- ^ "Explore Census Data". data.census.gov. Retrieved May 20, 2022.
- ^ https://www.census.gov/ [not specific enough to verify]
- ^ "About the Hispanic Population and its Origin". www.census.gov. Retrieved May 18, 2022.
- ^ a b "NOAA Online Weather Data – NWS Brownsville". National Weather Service. Retrieved July 3, 2023.
- ^ "U.S. Climate Normals Quick Access – Station: Port Mansfield, TX". National Oceanic and Atmospheric Administration. Retrieved July 3, 2023.
External links edit
- Handbook of Texas Online article