
KNOWPIA
WELCOME TO KNOWPIA

Preston City Council elections 
Summary
Preston City Council elections are generally held three years out of every four, with a third of the council elected each time. Preston City Council is the local authority for the non-metropolitan district of Preston in Lancashire, England. Since the last boundary changes in 2019, 48 councillors have been elected from 16 wards.[1]


Notes
- † Independent 1, Labour Independent 1
- i Independent 1
- * Labour Independent 2
- ^ Labour Independent 3, People's Party 1
- # Independent 2 (one elected as Socialist Alliance Against the War[2]), Labour Independent 2
- α Deepdale Independent 2
- β Deepdale Independent 2, Independent Socialist 1
- γ Deepdale Independent 1
- ** Independent 1, Deepdale Independent 1
- 1 During September 1999 two councillors formed "The People's Party"[2]
- 2 During November 2008 one councillor changed his designation from the Respect Party to Independent Socialist[2]
- 3 During August 2018 two councillors formed an Independent Conservatives group.[2]
- 4 During May 2020 one councillor resigned their seat, which remained vacant until restrictions in place due to the COVID-19 pandemic are lifted.
Council elections edit
1970s edit
- 1973 Preston Borough Council election
- 1975 Preston Borough Council election
- 1976 Preston Borough Council election (New ward boundaries)[3]
- 1978 Preston Borough Council election
- 1979 Preston Borough Council election
1980s edit
- 1980 Preston Borough Council election
- 1982 Preston Borough Council election
- 1983 Preston Borough Council election
- 1984 Preston Borough Council election
- 1986 Preston Borough Council election
- 1987 Preston Borough Council election
- 1988 Preston Borough Council election
1990s edit
- 1990 Preston Borough Council election (New ward boundaries)[4]
- 1991 Preston Borough Council election
- 1992 Preston Borough Council election
- 1994 Preston Borough Council election
- 1995 Preston Borough Council election
- 1996 Preston Borough Council election
- 1998 Preston Borough Council election
- 1999 Preston Borough Council election
2000s edit
- 2000 Preston Borough Council election
- 2002 Preston Borough Council election (New ward boundaries)[5][6]
- 2003 Preston City Council election
- 2004 Preston City Council election
- 2006 Preston City Council election
- 2007 Preston City Council election (Some new ward boundaries)[7]
- 2008 Preston City Council election
2010s edit
- 2010 Preston City Council election
- 2011 Preston City Council election
- 2012 Preston City Council election
- 2014 Preston City Council election
- 2015 Preston City Council election
- 2016 Preston City Council election
- 2018 Preston City Council election
- 2019 Preston City Council election (New ward boundaries)[1]
2020s edit
District result maps edit
-
 2002 results map
 -
 2003 results map
 -
 2004 results map
 -
 2006 results map
 -
 2007 results map
 -
 2008 results map
 -
 2010 results map
 -
 2011 results map
 -
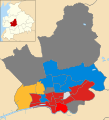
 2019 results map
 -
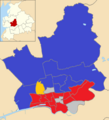
 2021 results map
 -
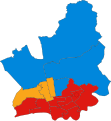 2022 results map
 -
 2023 results map


Changes between elections edit
1990 boundaries edit
| Party | Candidate | Votes | % | ±% | |
|---|---|---|---|---|---|
| Labour | Veronica Afrin | 617 | 41.5 | -28.6 | |
| Liberal Democrats | Anna Riedel | 383 | 25.8 | +13.2 | |
| Independent | Paul Malliband | 278 | 18.7 | N/A | |
| Conservative | Elaine Pugh | 179 | 12.0 | -5.2 | |
| Independent | Gerald Kerrone | 30 | 2.0 | N/A | |
| Majority | 234 | 15.7 | |||
| Turnout | 1,487 | 30.1 | |||
| Labour hold | Swing | ||||
| Party | Candidate | Votes | % | ±% | |
|---|---|---|---|---|---|
| Labour | John Swindells | 361 | 64.6 | -3.6 | |
| Conservative | David Hammond | 134 | 24.0 | +8.6 | |
| Independent | Bernadette Jones | 64 | 1.5 | N/A | |
| Majority | 227 | 40.6 | |||
| Turnout | 559 | 8.6 | |||
| Labour hold | Swing | ||||
| Party | Candidate | Votes | % | ±% | |
|---|---|---|---|---|---|
| Conservative | Harry Landless | 903 | 82.1 | +2.4 | |
| Liberal Democrats | John Bruton | 153 | 13.9 | +2.9 | |
| Labour | Terry Mattinson | 44 | 4.0 | -5.3 | |
| Majority | 750 | 68.2 | |||
| Turnout | 1,100 | 21.0 | |||
| Conservative hold | Swing | ||||
| Party | Candidate | Votes | % | ±% | |
|---|---|---|---|---|---|
| Labour | Peter Ward | 501 | 48.8 | +24.0 | |
| Liberal Democrats | Danny Gallagher | 349 | 34.0 | -23.8 | |
| Conservative | R Turner | 110 | 10.7 | -0.4 | |
| Independent | I Heywood | 67 | 6.5 | +0.2 | |
| Majority | 152 | 14.8 | |||
| Turnout | 1,027 | 23.7 | |||
| Labour gain from Liberal Democrats | Swing | +23.9 | |||
2007 boundaries edit
| Party | Candidate | Votes | % | ±% | |
|---|---|---|---|---|---|
| Labour | Peter Rankin | 423 | 34.3 | -6.8 | |
| Liberal Democrats | Rick Seymour | 400 | 32.4 | +21.5 | |
| Conservative | Paul Balshaw | 292 | 23.6 | -6.7 | |
| No description | Barry Hill | 84 | 6.8 | N/A | |
| Green | Kizzi Murtagh | 36 | 2.9 | N/A | |
| Majority | 23 | 1.9 | |||
| Turnout | 1,235 | ||||
| Labour hold | Swing | -14.2 | |||
| Party | Candidate | Votes | % | ±% | |
|---|---|---|---|---|---|
| Labour | Jennifer Mein | 656 | 55.7 | +13.2 | |
| Conservative | Sharon Riley | 283 | 24.0 | +3.9 | |
| Liberal Democrats | Luke Bosman | 239 | 20.3 | +1.3 | |
| Majority | 373 | 31.7 | |||
| Turnout | 1,178 | 30.9 | |||
| Labour hold | Swing | +8.6 | |||
| Party | Candidate | Votes | % | ±% | |
|---|---|---|---|---|---|
| Labour Co-op | Linda Crompton | 890 | 66.72 | ||
| Liberal Democrats | Stephen Wilkinson | 388 | 29.09 | ||
| Green | Adam Vardey | 56 | 4.20 | ||
| Majority | 502 | 37.63 | |||
| Turnout | 1,334 | ||||
| Labour gain from Liberal Democrats | Swing | +8.6 | |||
| Party | Candidate | Votes | % | ±% | |
|---|---|---|---|---|---|
| Liberal Democrats | John Potter | 721 | 43.1 | -14.0 | |
| Labour | John Young | 476 | 28.5 | +20.8 | |
| Conservative | David Walker | 465 | 28.4 | -6.9 | |
| Majority | 245 | 14.7 | -141 | ||
| Turnout | 1,672 | ||||
| Liberal Democrats hold | Swing | -3.6 | |||
| Party | Candidate | Votes | % | ±% | |
|---|---|---|---|---|---|
| Labour | Liz Atkins | 648 | 47.89 | +3.29 | |
| Conservative | Michael Balshaw | 477 | 35.25 | +2.28 | |
| Liberal Democrats | Jeremy Dable | 166 | 12.27 | +4.15 | |
| UKIP | Simon Platt | 62 | 4.58 | -3.37 | |
| Majority | 171 | 12.64 | +1.01 | ||
| Turnout | 1,353 | ||||
| Labour hold | Swing | ||||
| Party | Candidate | Votes | % | ±% | |
|---|---|---|---|---|---|
| Conservative | Ron Woollam | 987 | 69.46 | -0.84 | |
| Labour | Joshua Mascord | 216 | 15.20 | -14.50 | |
| Liberal Democrats | David Callaghan | 160 | 11.26 | N/A | |
| UKIP | Kieran Aspden | 58 | 4.08 | N/A | |
| Majority | 771 | 54.26 | |||
| Turnout | 1,421 | ||||
| Conservative hold | Swing | ||||
Conservative councillor Damien Moore (Greyfriars) resigned from the council in March 2018 (he was elected Member of Parliament for Southport in 2017).[14] The seat (term ending 2019 due to boundary changes[15] trigger a full election) was filled in a double election for Greyfriars on 3 May.[16]
References edit
- ^ a b "The Preston (Electoral Changes) Order 2017", legislation.gov.uk, The National Archives, SI 2018/548, retrieved 24 August 2022
- ^ a b c d "Political history composition of Preston City Council" (PDF). Preston City Council. Retrieved 5 June 2020.
- ^ The Borough of Preston (Electoral Arrangements) Order 1975
- ^ legislation.gov.uk - The Borough of Preston (Electoral Arrangements) Order 1989. Retrieved on 4 November 2015.
- ^ "Preston". BBC News Online. Retrieved 26 October 2009.
- ^ legislation.gov.uk - The Borough of Preston (Electoral Changes) Order 2001. Retrieved on 4 October 2015.
- ^ legislation.gov.uk - The Preston (Electoral Changes) Order 2007. Retrieved on 3 November 2015.
- ^ Afrin predicts nasty campaign in by-election Lancashire Telegraph (written 10 September 1998)
- ^ "Tulketh by-election". Preston City Council. Archived from the original on 16 July 2011. Retrieved 26 October 2009.
- ^ "Fishwick by-election". Preston City Council. Archived from the original on 16 July 2011. Retrieved 3 October 2009.
- ^ Statement of Persons Nomination Archived 28 September 2011 at the Wayback Machine Preston City Council
- ^ "Preston City Council • Elections". Archived from the original on 28 September 2011. Retrieved 6 August 2010. Preston City Council
- ^ a b Walker, Ed. "Preston by-election results: Who won in Ashton and Preston Rural East?". Blog Preston. Retrieved 6 May 2017.
- ^ "They break ties in Ockendon | LocalCouncils.co.uk". localcouncils.co.uk. Retrieved 31 March 2018.
- ^ "Local Government Boundary Commission for England Consultation Portal". consultation.lgbce.org.uk. Retrieved 31 March 2018.
- ^ th.palin. "Elections 2018 | Preston City Council". www.preston.gov.uk. Retrieved 31 March 2018.
- By-election results
External links edit
- Preston Council