


Summary
A psychometric function is an inferential psychometric model applied in detection and discrimination tasks. It models the relationship between a given feature of a physical stimulus, e.g. velocity, duration, brightness, weight etc., and forced-choice responses of a human or animal test subject. The psychometric function therefore is a specific application of the generalized linear model (GLM) to psychophysical data. The probability of response is related to a linear combination of predictors by means of a sigmoid link function (e.g. probit, logit, etc.).
Design edit
Depending on the number of choices, the psychophysical experimental paradigms classify as simple forced choice (also known as yes-no task), two-alternative forced choice (2AFC), and n-alternative forced choice. The number of alternatives in the experiment determine the lower asymptote of the function.
Example edit
A common example is visual acuity testing with an eye chart. The person sees symbols of different sizes (the size is the relevant physical stimulus parameter) and has to decide which symbol it is. Usually, there is one line on the chart where a subject can identify some, but not all, symbols. This is equal to the transition range of the psychometric function and the sensory threshold corresponds to visual acuity. (Strictly speaking, a typical optometric measurement does not exactly yield the sensory threshold due to biases in the standard procedure.)
Plotting edit
Two different types of psychometric plots are in common use:
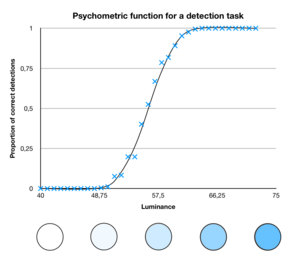
- Plot the percentage of correct responses (or a similar value) displayed on the y-axis and the physical parameter on the x-axis. If the stimulus parameter is very far towards one end of its possible range, the person will always be able to respond correctly. Towards the other end of the range, the person never perceives the stimulus properly and therefore the probability of correct responses is at chance level. In between, there is a transition range where the subject has an above-chance rate of correct responses, but does not always respond correctly. The inflection point of the sigmoid function or the point at which the function reaches the middle between the chance level and 100% is usually taken as sensory threshold.
- Plot the proportion of "yes" responses on the y-axis, and therefore create a sigmoidal shape covering the range [0, 1], rather than merely [0.5, 1]. This moves from a subject being certain that the stimulus was not of the particular type requested to certainty that it was.
The second way of plotting psychometric functions is often preferable, as it is more easily amenable to principled quantitative analysis using tools such as probit analysis (fitting of cumulative Gaussian distributions). However, it also has important drawbacks. First, the threshold estimation is based only on p(yes), namely on "Hit" in Signal Detection Theory terminology. Second, and consequently, it is not bias free or criterion free. Third, the threshold is identified with the p(yes) = .5, which is just a conventional and arbitrary choice.
References edit
- Wichmann, Felix A., and Frank Jäkel. "Methods in psychophysics." Stevens' Handbook of Experimental Psychology and Cognitive Neuroscience 5 (2018): 1-42.