


Summary
Puttalam (Sinhala: පුත්තලම, romanized: Puttalama; Tamil: புத்தளம், romanized: Puttaḷam) is the largest town in Puttalam District, North Western Province, Sri Lanka. Puttalam is the administrative capital of the Puttalam District and governed by an Urban Council.
Puttalam පුත්තලම புத்தளம் | |
|---|---|
Town | |
 | |
 Puttalam පුත්තලම புத்தளம் | |
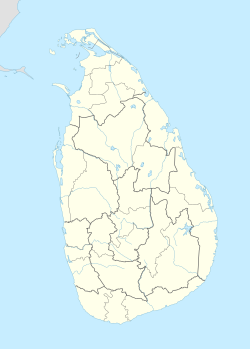
| Coordinates: 08°02′03″N 79°50′07″E / 8.03417°N 79.83528°E | |
| Country | Sri Lanka |
| Province | North Western |
| District | Puttalam District |
| Divisional Secretariat | Puttalam Division |
| Government | |
| • Type | Puttalam Urban Council |
| • Chairman | Vacant since May 2021.[1] |
| Area | |
| • Town | 25.6 km2 (9.9 sq mi) |
| • Land | 119.0 km2 (45.9 sq mi) |
| • Water | 327 km2 (126 sq mi) |
| Population (2012)[2] | |
| • Town | 45,511 (Urban Council) |
| • Density | 400/km2 (1,000/sq mi) |
| • Urban density | 1,778/km2 (4,600/sq mi) |
| • Metro | 82,443 (Puttalam Division) |
| • Metro density | 471.1/km2 (1,220/sq mi) |
| Time zone | UTC+05:30 (Sri Lanka Standard Time Zone) |
Climate edit
Under the Köppen climate classification, Pattalam has a tropical savanna climate with a short dry season from June to September and a second dry season from January to March. The wet season is mainly from October to December. Temperatures remain steady throughout the year with little variations in between.
| Climate data for Puttalam (1991–2020) | |||||||||||||
|---|---|---|---|---|---|---|---|---|---|---|---|---|---|
| Month | Jan | Feb | Mar | Apr | May | Jun | Jul | Aug | Sep | Oct | Nov | Dec | Year |
| Record high °C (°F) | 34.4 (93.9) |
36.4 (97.5) |
38.5 (101.3) |
38.5 (101.3) |
36.2 (97.2) |
35.4 (95.7) |
34.9 (94.8) |
35.5 (95.9) |
35.7 (96.3) |
35.5 (95.9) |
34.5 (94.1) |
33.1 (91.6) |
38.5 (101.3) |
| Mean daily maximum °C (°F) | 30.7 (87.3) |
32.3 (90.1) |
33.5 (92.3) |
33.2 (91.8) |
32.5 (90.5) |
31.7 (89.1) |
31.5 (88.7) |
31.7 (89.1) |
31.8 (89.2) |
31.3 (88.3) |
30.7 (87.3) |
30.0 (86.0) |
31.8 (89.2) |
| Daily mean °C (°F) | 26.2 (79.2) |
27.0 (80.6) |
28.6 (83.5) |
28.9 (84.0) |
29.5 (85.1) |
29.2 (84.6) |
28.9 (84.0) |
28.9 (84.0) |
28.9 (84.0) |
28.1 (82.6) |
27.1 (80.8) |
26.4 (79.5) |
28.1 (82.6) |
| Mean daily minimum °C (°F) | 21.4 (70.5) |
21.7 (71.1) |
23.4 (74.1) |
24.7 (76.5) |
26.5 (79.7) |
26.7 (80.1) |
26.3 (79.3) |
26.2 (79.2) |
25.9 (78.6) |
24.7 (76.5) |
23.5 (74.3) |
22.6 (72.7) |
24.5 (76.1) |
| Record low °C (°F) | 15.6 (60.1) |
16.2 (61.2) |
17.0 (62.6) |
20.5 (68.9) |
19.7 (67.5) |
22.7 (72.9) |
22.0 (71.6) |
22.5 (72.5) |
21.4 (70.5) |
21.3 (70.3) |
17.4 (63.3) |
15.7 (60.3) |
15.6 (60.1) |
| Average precipitation mm (inches) | 50.5 (1.99) |
42.1 (1.66) |
56.9 (2.24) |
154.4 (6.08) |
101.8 (4.01) |
32.1 (1.26) |
23.5 (0.93) |
23.3 (0.92) |
69.2 (2.72) |
230.6 (9.08) |
254.6 (10.02) |
143.7 (5.66) |
1,182.6 (46.56) |
| Average precipitation days (≥ 1.0 mm) | 5.6 | 4.2 | 4.5 | 9.5 | 6.5 | 4.2 | 2.1 | 3.4 | 5.8 | 12.8 | 15.3 | 10.8 | 84.7 |
| Source: NOAA[3] | |||||||||||||
Important Places edit
Energy edit
Seguwantivu Wind Power (Private) Limited an Indian firm invests US$37 million and maintains 25 wind turbines which produce 20 MW s of electricity in Puttalam Seguwantivu region. [1]
Education edit
National Schools[7] edit
- St. Andrew's Central College
- Ananda National School
- Zahira College,Puttalam
- Kalpitiya Nirmala Matha National College.
- President's Science College
- Fathima Muslim Ladies College[8]
- Science High School Puttalam
Provincial Schools edit
- Puttalam Hindu Central College
- Thillayadi Muslim Maha Vidhyalaya
- Zahira Primary School
- Manal Kundru Muslim Maha Vidhiyalaya
- Zainab Muslim Girl's Primary
- Assenkudhoos Government Muslim Vidyalayam
International schools edit
- Phoenix International School
- Puttalam Primary school and child care centre
- KEC
- St. Joseph Vaz College
- Ikra International School
- School Of Excellence [9]
Puttalam also has an Open University.
Religion edit
Puttalam is a multi-cultural and multi-religious town. Islam is major religion in Puttalam town while Buddhist and Christians are significant minorities with a small Hindu population.[10]
Source:statistics.gov.lk
Religious Places edit
- Mohideen Jumma Mosque
- බෞද්ධ මධ්යස්ථානය
- முத்து மாரியம்மன் கோவில்
- Mother of Refuge Catholic Church
| Climate data for Puttalam (1961–1990) | |||||||||||||
|---|---|---|---|---|---|---|---|---|---|---|---|---|---|
| Month | Jan | Feb | Mar | Apr | May | Jun | Jul | Aug | Sep | Oct | Nov | Dec | Year |
| Record high °C (°F) | 35.0 (95.0) |
37.9 (100.2) |
38.5 (101.3) |
38.5 (101.3) |
36.2 (97.2) |
36.1 (97.0) |
36.7 (98.1) |
35.5 (95.9) |
35.7 (96.3) |
35.5 (95.9) |
36.1 (97.0) |
34.6 (94.3) |
38.5 (101.3) |
| Mean daily maximum °C (°F) | 30.5 (86.9) |
32.1 (89.8) |
33.2 (91.8) |
33.1 (91.6) |
32.3 (90.1) |
31.5 (88.7) |
31.4 (88.5) |
31.5 (88.7) |
31.7 (89.1) |
31.1 (88.0) |
30.5 (86.9) |
29.9 (85.8) |
31.6 (88.9) |
| Daily mean °C (°F) | 25.8 (78.4) |
26.8 (80.2) |
28.1 (82.6) |
28.8 (83.8) |
29.0 (84.2) |
28.8 (83.8) |
28.5 (83.3) |
28.5 (83.3) |
28.5 (83.3) |
27.6 (81.7) |
26.7 (80.1) |
26.0 (78.8) |
27.8 (82.0) |
| Mean daily minimum °C (°F) | 21.0 (69.8) |
21.4 (70.5) |
23.1 (73.6) |
24.5 (76.1) |
25.8 (78.4) |
26.2 (79.2) |
25.6 (78.1) |
25.5 (77.9) |
25.3 (77.5) |
24.1 (75.4) |
22.9 (73.2) |
22.1 (71.8) |
24.0 (75.2) |
| Record low °C (°F) | 15.2 (59.4) |
13.5 (56.3) |
14.9 (58.8) |
19.9 (67.8) |
19.7 (67.5) |
20.4 (68.7) |
21.0 (69.8) |
20.2 (68.4) |
20.4 (68.7) |
19.4 (66.9) |
16.7 (62.1) |
16.7 (62.1) |
13.5 (56.3) |
| Average precipitation mm (inches) | 55 (2.2) |
40 (1.6) |
66 (2.6) |
176 (6.9) |
95 (3.7) |
42 (1.7) |
16 (0.6) |
16 (0.6) |
64 (2.5) |
238 (9.4) |
249 (9.8) |
138 (5.4) |
1,195 (47.0) |
| Average relative humidity (%) (at Daytime) | 70 | 66 | 67 | 71 | 74 | 73 | 73 | 73 | 72 | 75 | 76 | 75 | 72 |
| Source 1: NOAA [11] | |||||||||||||
| Source 2: Department of Meteorology (records up to 2007)[12]
"Puttalam records from 2007 to 2021" (in French). Meteo Climat. Retrieved 25 August 2021. | |||||||||||||
Notable people edit
- M. H. M. Naina Marikar - First elected to the Parliament of Sri Lanka as member for Puttalam
- H. S. Ismail- 5th Speaker of the Parliament of Sri Lanka
- M. H. M. Navavi - Politician, Former Member of Parliament
- Sahan Adeesha - Cricketer, was born in Puttalam
- Tariq Hisny - Composer, was born in Puttalam
- Abdul Baiz Kamardeen - Politician, Former Chairman of Puttalam Urban Council
- Ali Sabri Raheem - Politician, Member of Parliament
- Hector Appuhamy - Politician, Member of Parliament
- Rosmin Mahroof - NASA Scientist
References edit
- ^ "The Chairman of puttalam urban council died following a road accident".
- ^ "Sri Lanka: Provinces, Districts, Divisional Secretariats, Cities - Population Statistics in Maps and Charts".
- ^ "World Meteorological Organization Climate Normals for 1991-2020 — Puttalam". National Oceanic and Atmospheric Administration. Retrieved January 20, 2024.
- ^ "Puttalam Lagoon", Wikipedia, 2023-03-15, retrieved 2023-07-25
- ^ "Puttalam Salt". www.puttalamsalt.lk. Retrieved 2023-07-25.
- ^ "Seguwantivu and Vidatamunai Wind Farms", Wikipedia, 2021-08-21, retrieved 2023-07-25
- ^ "Provincial Department of Education - North Western". nwpedu.lk. Retrieved 2021-03-14.
- ^ "புத்தளம் பாத்திமாவின் புதிய அதிபராக கல்லூரியின் பழைய மாணவி பதவியேற்பு – Puttalam Online". Retrieved 2023-04-05.
- ^ Sanoon, Text and pictures by M. U. M.; Corr, Puttalam TKN. "Eleven years of excellence". Daily News. Retrieved 2023-03-05.
- ^ http://www.statistics.gov.lk/PopHouSat/CPH2012Visualization/htdocs/index.php?usecase=indicator&action=DSMap&indId=10&district=Puttalam&Legend=3# statistics.gov.lk
- ^ "Puttalam Climate Normals 1961–1990". National Oceanic and Atmospheric Administration. Retrieved November 18, 2016.
- ^ "Ever Recorded Daily Extreme Values" (PDF). Department of Meteorology. Archived from the original (PDF) on December 29, 2009. Retrieved December 8, 2016.
External links edit
- The Portuguese Cultural Imprint on Sri Lanka
- images [2]