


Summary
In statistical hypothesis testing, specifically multiple hypothesis testing, the q-value in the Storey-Tibshirani procedure provides a means to control the positive false discovery rate (pFDR).[1] Just as the p-value gives the expected false positive rate obtained by rejecting the null hypothesis for any result with an equal or smaller p-value, the q-value gives the expected pFDR obtained by rejecting the null hypothesis for any result with an equal or smaller q-value.
History edit
In statistics, testing multiple hypotheses simultaneously using methods appropriate for testing single hypotheses tends to yield many false positives: the so-called multiple comparisons problem.[2] For example, assume that one were to test 1,000 null hypotheses, all of which are true, and (as is conventional in single hypothesis testing) to reject null hypotheses with a significance level of 0.05; due to random chance, one would expect 5% of the results to appear significant (P < 0.05), yielding 50 false positives (rejections of the null hypothesis).[3] Since the 1950s, statisticians had been developing methods for multiple comparisons that reduced the number of false positives, such as controlling the family-wise error rate (FWER) using the Bonferroni correction, but these methods also increased the number of false negatives (i.e. reduced the statistical power).[2] In 1995, Yoav Benjamini and Yosef Hochberg proposed controlling the false discovery rate (FDR) as a more statistically powerful alternative to controlling the FWER in multiple hypothesis testing.[2] The pFDR and the q-value were introduced by John D. Storey in 2002 in order to improve upon a limitation of the FDR, namely that the FDR is not defined when there are no positive results.[1][4]
Definition edit
Let there be a null hypothesis and an alternative hypothesis . Perform hypothesis tests; let the test statistics be i.i.d. random variables such that . That is, if is true for test ( ), then follows the null distribution ; while if is true ( ), then follows the alternative distribution . Let , that is, for each test, is true with probability and is true with probability . Denote the critical region (the values of for which is rejected) at significance level by . Let an experiment yield a value for the test statistic. The q-value of is formally defined as


That is, the q-value is the infimum of the pFDR if is rejected for test statistics with values . Equivalently, the q-value equals


which is the infimum of the probability that is true given that is rejected (the false discovery rate).[1]
Relationship to the p-value edit
The p-value is defined as

the infimum of the probability that is rejected given that is true (the false positive rate). Comparing the definitions of the p- and q-values, it can be seen that the q-value is the minimum posterior probability that is true.[1]
Interpretation edit
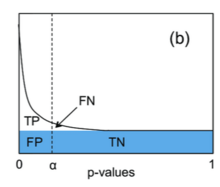
The q-value can be interpreted as the false discovery rate (FDR): the proportion of false positives among all positive results. Given a set of test statistics and their associated q-values, rejecting the null hypothesis for all tests whose q-value is less than or equal to some threshold ensures that the expected value of the false discovery rate is .[5]
Applications edit
Biology edit
Gene expression edit
Genome-wide analyses of differential gene expression involve simultaneously testing the expression of thousands of genes. Controlling the FWER (usually to 0.05) avoids excessive false positives (i.e. detecting differential expression in a gene that is not differentially expressed) but imposes a strict threshold for the p-value that results in many false negatives (many differentially expressed genes are overlooked). However, controlling the pFDR by selecting genes with significant q-values lowers the number of false negatives (increases the statistical power) while ensuring that the expected value of the proportion of false positives among all positive results is low (e.g. 5%).[5]
For example, suppose that among 10,000 genes tested, 1,000 are actually differentially expressed and 9,000 are not:
- If we consider every gene with a p-value of less than 0.05 to be differentially expressed, we expect that 450 (5%) of the 9,000 genes that are not differentially expressed will appear to be differentially expressed (450 false positives).
- If we control the FWER to 0.05, there is only a 5% probability of obtaining at least one false positive. However, this very strict criterion will reduce the power such that few of the 1,000 genes that are actually differentially expressed will appear to be differentially expressed (many false negatives).
- If we control the pFDR to 0.05 by considering all genes with a q-value of less than 0.05 to be differentially expressed, then we expect 5% of the positive results to be false positives (e.g. 900 true positives, 45 false positives, 100 false negatives, 8,955 true negatives). This strategy enables one to obtain relatively low numbers of both false positives and false negatives.
Implementations edit
Note: the following is an incomplete list.
R edit
References edit
- ^ a b c d Storey, John D. (2003). "The positive false discovery rate: a Bayesian interpretation and the q-value". The Annals of Statistics. 31 (6): 2013–2035. doi:10.1214/aos/1074290335.
- ^ a b c Benjamini, Yoav; Hochberg, Yosef (1995). "Controlling the false discovery rate: a practical and powerful approach tomultiple testing". Journal of the Royal Statistical Society. Series B (Methodological). 57: 289–300. doi:10.1111/j.2517-6161.1995.tb02031.x.
- ^ Nuzzo, Regina (2014). "Scientific method: Statistical errors". Nature. Retrieved 5 March 2019.
- ^ Storey, John D. (2002). "A direct approach to false discovery rates". Journal of the Royal Statistical Society, Series B (Statistical Methodology). 64 (3): 479–498. CiteSeerX 10.1.1.320.7131. doi:10.1111/1467-9868.00346.
- ^ a b Storey, John D.; Tibshirani, Robert (2003). "Statistical significance for genomewide studies". PNAS. 100 (16): 9440–9445. Bibcode:2003PNAS..100.9440S. doi:10.1073/pnas.1530509100. PMC 170937. PMID 12883005.
- ^ Storey, John D.; Bass, Andrew J.; Dabney, Alan; Robinson, David; Warnes, Gregory (2019). "qvalue: Q-value estimation for false discovery rate control". Bioconductor.