


Summary
The reserves-to-production ratio (RPR or R/P) is the remaining amount of a non-renewable resource, expressed in time. While applicable to all natural resources, the RPR is most commonly applied to fossil fuels, particularly petroleum and natural gas. The reserve portion (numerator) of the ratio is the amount of a resource known to exist in an area and to be economically recoverable (proven reserves). The production portion (denominator) of the ratio is the amount of resource produced in one year at the current rate.[1]
RPR = (amount of known resource) / (amount used per year)
This ratio is used by companies and government agencies in forecasting the future availability of a resource to determine project life, future income, employment, etc., and to determine whether more exploration must be undertaken to ensure continued supply of the resource. Annual production of a resource can usually be calculated to quite an accurate number. However, reserve quantities can only be estimated to varying degrees of accuracy, depending on the availability of information and on the methods used to evaluate them.[1]
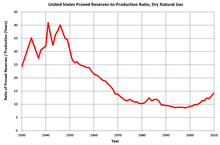
A simplistic interpretation of the ratio has led to many false predictions of imminent "running out of oil" since the early years of the oil industry in the 1800s. This has been especially true in the United States, where the ratio of proved reserves-to-production has been between 8 years and 17 years since 1920. Many have mistakenly interpreted the result as the number of years before the oil supply is exhausted. Such analyses do not take into account future reserve growth.[2]
Significance and interpretation edit


The reserves-to-production ratio is the most widely quoted of the key indicators used in the oil and gas industry. It has a certain strategic significance for companies, which try to keep the value reasonably constant at approximately 10 years. A ratio which falls too low indicates a company in poor health. For a country or region, a value which falls too low can be a warning of impending scarcity. Globally, the RPR for petroleum varies from 8 years in the North Sea to 80 years in the Middle East.[3] The former is typical of a region undergoing a steep production decline, the latter a region which will be continuing to produce oil well into the future.
The reserves-to-production ratio can be misleading to the average person, particularly since it is expressed in years. The fact that a region has a RPR of 40 years does not mean that it will continue to produce the resource for 40 years, at which point it will suddenly run out, and then production will decline to zero. More commonly, a resource will show an increase in production until it reaches a peak, and then production will plateau and enter a declining phase. In theoretical terms, this is more accurately described by the Hubbert curve, a bell-shaped curve which is the mathematical derivative of the logistics function.
The magnitude of the RPR is inversely related to the annual rate of production, which may depend on geological features. For example, a highly fractured oil reserve with water drive may have a RPR as low as 6 years. By contrast, a low permeability oil reserve may have a RPR as high as 50 or 100 years. Government policies may deliberately slow production, thereby increasing the RPR in the interests of prolonging reserve life, whereas a company may inject water and/or gases into a reservoir to increase production, thereby decreasing the RPR—the increased production comes at the expense of decreased reserve life. The RPR depends significantly on the stage of resource development. Typically, there is a high initial RPR during the early phases of development, then the RPR sharply declines toward the maximum level of production. Following to the production decline, the magnitude of the P/R ratio can either continue to decline, remain stable for some period of time, or increase, especially when a production slump occurs.[4]
New discoveries, changes in technology, or changes in economic conditions, can significantly alter the ratio in a short period of time, while misevaluation by involved parties can produce inaccurate and/or misleading results. Optimism or pessimism can influence reserve estimates. Further, reserves are resources that are economically recoverable under existing conditions. Reserves may change as a result of political change, or by manipulation.[5] Consumption of many resources is not constant, but typically increases [6] as the population grows and becomes more prosperous. Non-constant values for both the numerator and denominator of the ratio implies it may either overestimate or underestimate the remaining life of the resource.
Fossil fuel reserve-to-production ratios edit

Reserve-to-production ratios may be calculated for individual countries or globally for specific resources. Oil, coal, and gas are the three most important fuels for powering the modern world. These resources are not uniformly distributed over the earth, so some countries have larger reserves than others. Due to the uncertainty of the reserves numbers, estimates of RPR vary widely. Following table is from the data of the year 2015 by BP statistical review.[7]
| Fuel | Unit of measure | Reserves | Annual Production | RPR (years) |
|---|---|---|---|---|
| Oil | billions of tons | 240 | 5 | 51 |
| Coal | billions of tons | 890 | 8 | 114 |
| Natural gas | trillions of cubic meters | 190 | 4 | 53 |
See also edit
References edit
- ^ a b "Reserves to Production Ratio". Investopedia. 2009. Retrieved 2009-05-25.
- ^ Deffeyes, Kenneth S. (2001). Hubbert's Peak: The Impending World Oil Shortage. Princeton University press. pp. 1–13. Archived from the original on 2010-07-03.
- ^ Babusiaux, Denis (2008). Oil and gas exploration and production: reserves, costs, contracts. Editions Ophrys. p. 112. ISBN 978-2-7108-0893-0.
- ^ Feygin, M.; Satkin, R. (2004). "The Oil Reserves-to-Production Ratio and Its Proper Interpretation". Natural Resources Research. 13 (1 / March 2004). Springer Netherlands: 57–60. doi:10.1023/B:NARR.0000023308.84994.7f.
- ^ "Proven oil reserves". Retrieved 2008-11-08.
- ^ Roberts, Paul (2004). The End of Oil. Houghton Mifflin Company. p. 245. ISBN 0-618-23977-4.
- ^ BP (2016-06-01). "Primary energy - 2015 in review". Retrieved 2017-04-22.