
KNOWPIA
WELCOME TO KNOWPIA

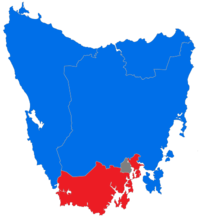
Results of the 2013 Australian federal election in Tasmania 
Summary
This is a list of electoral division results for the 2013 Australian federal election in the state of Tasmania.[1]
| ||||||||||||||||||||||||||||||||||
All 5 Tasmanian seats in the House of Representatives and all 12 seats in the Senate | ||||||||||||||||||||||||||||||||||
|---|---|---|---|---|---|---|---|---|---|---|---|---|---|---|---|---|---|---|---|---|---|---|---|---|---|---|---|---|---|---|---|---|---|---|
| ||||||||||||||||||||||||||||||||||
 | ||||||||||||||||||||||||||||||||||

Overall result edit
| Party | Votes | % | Swing | Seats | Change | |
|---|---|---|---|---|---|---|
| Liberal Party of Australia | 132,961 | 40.26 | +6.66 | 3 | ||
| Australian Labor Party | 114,977 | 34.81 | –9.14 | 1 | ||
| Australian Greens | 27,467 | 8.32 | –8.50 | |||
| Palmer United Party | 20,026 | 6.06 | +6.06 | |||
| Family First Party | 4,971 | 1.51 | +1.51 | |||
| Rise Up Australia Party | 1,824 | 0.55 | +0.55 | |||
| Australian Christians | 963 | 0.29 | +0.29 | |||
| Australian Sex Party | 877 | 0.27 | +0.27 | |||
| Democratic Labour Party | 554 | 0.17 | +0.17 | |||
| Katter's Australian Party | 478 | 0.14 | +0.14 | |||
| Secular Party of Australia | 384 | 0.12 | –0.21 | |||
| Australian Stable Population Party | 124 | 0.04 | +0.04 | |||
| Independents | 24,688 | 7.47 | +2.69 | 1 | ||
| Total | 330,294 | 5 | ||||
| Two-party-preferred vote | ||||||
| Australian Labor Party | 169,208 | 51.23 | –9.39 | 1 | ||
| Liberal/National Coalition | 161,086 | 48.77 | +9.39 | 3 | ||

Results by division edit
Bass edit
| Party | Candidate | Votes | % | ±% | |
|---|---|---|---|---|---|
| Liberal | Andrew Nikolic | 31,267 | 47.85 | +8.14 | |
| Labor | Geoff Lyons | 22,643 | 34.65 | −8.78 | |
| Greens | Lucy Landon-Lane | 5,160 | 7.90 | −7.68 | |
| Palmer United | Christopher Dobson | 3,520 | 5.39 | +5.39 | |
| Family First | Christine Bergman | 1,407 | 2.15 | +2.15 | |
| Christians | Ray Kroeze | 963 | 1.47 | +1.47 | |
| Secular | Jin-oh Choi | 384 | 0.59 | +0.59 | |
| Total formal votes | 65,344 | 95.82 | −0.20 | ||
| Informal votes | 2,850 | 4.18 | +0.20 | ||
| Turnout | 68,194 | 94.46 | −0.70 | ||
| Two-party-preferred result | |||||
| Liberal | Andrew Nikolic | 35,310 | 54.04 | +10.78 | |
| Labor | Geoff Lyons | 30,034 | 45.96 | −10.78 | |
| Liberal gain from Labor | Swing | +10.78 | |||
Braddon edit
| Party | Candidate | Votes | % | ±% | |
|---|---|---|---|---|---|
| Liberal | Brett Whiteley | 30,904 | 46.86 | +7.51 | |
| Labor | Sid Sidebottom | 24,791 | 37.59 | −11.09 | |
| Palmer United | Kevin Morgan | 6,125 | 9.29 | +9.29 | |
| Greens | Melissa Houghton | 3,410 | 5.17 | −6.79 | |
| Rise Up Australia | Bernard Shaw | 726 | 1.10 | +1.10 | |
| Total formal votes | 65,956 | 96.45 | +0.77 | ||
| Informal votes | 2,428 | 3.55 | −0.77 | ||
| Turnout | 68,384 | 95.41 | −0.24 | ||
| Two-party-preferred result | |||||
| Liberal | Brett Whiteley | 34,668 | 52.56 | +10.04 | |
| Labor | Sid Sidebottom | 31,288 | 47.44 | −10.04 | |
| Liberal gain from Labor | Swing | +10.04 | |||
Denison edit
| Party | Candidate | Votes | % | ±% | |
|---|---|---|---|---|---|
| Independent | Andrew Wilkie | 24,688 | 38.08 | +16.82 | |
| Labor | Jane Austin | 16,043 | 24.75 | −11.04 | |
| Liberal | Tanya Denison | 15,058 | 23.23 | +0.58 | |
| Greens | Anna Reynolds | 5,133 | 7.92 | −11.06 | |
| Palmer United | Debra Thurley | 1,576 | 2.43 | +2.43 | |
| Sex Party | Bob Butler | 877 | 1.35 | +1.35 | |
| Family First | Trevlyn McCallum | 593 | 0.91 | +0.91 | |
| Democratic Labour | Wayne Williams | 554 | 0.85 | +0.85 | |
| Rise Up Australia | Graeme Devlin | 179 | 0.28 | +0.28 | |
| Stable Population | Brandon Hoult | 124 | 0.19 | +0.19 | |
| Total formal votes | 64,825 | 95.78 | −0.60 | ||
| Informal votes | 2,856 | 4.22 | +0.60 | ||
| Turnout | 67,681 | 94.31 | −0.01 | ||
| Notional two-party-preferred count | |||||
| Labor | Jane Austin | 38,186 | 58.91 | −6.91 | |
| Liberal | Tanya Denison | 26,639 | 41.09 | +6.91 | |
| Two-candidate-preferred result | |||||
| Independent | Andrew Wilkie | 42,470 | 65.51 | +14.30 | |
| Labor | Jane Austin | 22,355 | 34.49 | −14.30 | |
| Independent hold | Swing | +14.30 | |||
Franklin edit
| Party | Candidate | Votes | % | ±% | |
|---|---|---|---|---|---|
| Labor | Julie Collins | 26,893 | 39.93 | −2.92 | |
| Liberal | Bernadette Black | 26,070 | 38.71 | +5.23 | |
| Greens | Rosalie Woodruff | 8,201 | 12.18 | −8.69 | |
| Palmer United | Marti Zucco | 4,108 | 6.10 | +6.10 | |
| Family First | Josh Downes | 1,264 | 1.88 | +1.88 | |
| Katter's Australian | Sarah Ugalde | 478 | 0.71 | +0.71 | |
| Rise Up Australia | Olwyn Bowden | 330 | 0.49 | +0.49 | |
| Total formal votes | 67,344 | 96.23 | −0.29 | ||
| Informal votes | 2,639 | 3.77 | +0.29 | ||
| Turnout | 69,983 | 95.09 | −0.37 | ||
| Two-party-preferred result | |||||
| Labor | Julie Collins | 37,103 | 55.09 | −5.73 | |
| Liberal | Bernadette Black | 30,241 | 44.91 | +5.73 | |
| Labor hold | Swing | −5.73 | |||
Lyons edit
| Party | Candidate | Votes | % | ±% | |
|---|---|---|---|---|---|
| Liberal | Eric Hutchinson | 29,662 | 44.39 | +11.70 | |
| Labor | Dick Adams | 24,607 | 36.82 | −12.09 | |
| Greens | Pip Brinklow | 5,563 | 8.32 | −8.43 | |
| Palmer United | Quentin Von Stieglitz | 4,697 | 7.03 | +7.03 | |
| Family First | Gaye James | 1,707 | 2.55 | +2.55 | |
| Rise Up Australia | Julian Rogers | 589 | 0.88 | +0.88 | |
| Total formal votes | 66,825 | 95.54 | +0.34 | ||
| Informal votes | 3,119 | 4.46 | −0.34 | ||
| Turnout | 69,944 | 94.64 | −0.14 | ||
| Two-party-preferred result | |||||
| Liberal | Eric Hutchinson | 34,228 | 51.22 | +13.51 | |
| Labor | Dick Adams | 32,597 | 48.78 | −13.51 | |
| Liberal gain from Labor | Swing | +13.51 | |||