


Summary
The following tables show state-by-state results in the Australian House of Representatives at the 2016 federal election, Coalition 76, Labor 69, Australian Greens 1, Nick Xenophon Team 1, Katter's Australian Party 1, with 2 independents.[1]
| ||||||||||||||||||||||||||||||||||||||||||||||||||||||||||||||||
All 150 seats in the Australian House of Representatives 76 seats needed for a majority | ||||||||||||||||||||||||||||||||||||||||||||||||||||||||||||||||
| Turnout | 91.0% | |||||||||||||||||||||||||||||||||||||||||||||||||||||||||||||||
|---|---|---|---|---|---|---|---|---|---|---|---|---|---|---|---|---|---|---|---|---|---|---|---|---|---|---|---|---|---|---|---|---|---|---|---|---|---|---|---|---|---|---|---|---|---|---|---|---|---|---|---|---|---|---|---|---|---|---|---|---|---|---|---|---|
This lists parties that won seats. See the complete results below.
| ||||||||||||||||||||||||||||||||||||||||||||||||||||||||||||||||

A number of initially-elected senators were declared ineligible a result of the 2017–18 Australian parliamentary eligibility crisis, and replaced after recounts.
Australia edit


Coalition
Liberal (45)
LNP (21)[i]
National (10)
Opposition (69)
Labor (69)
Crossbench (5)
Greens (1)
Xenophon (1)
Katter (1)
Independent (2)[ii]
- ^ 15 LNP MPs sit in the Liberal party room and 6 in the National party room
- ^ independent MPs: Andrew Wilkie (Denison) and Cathy McGowan (Indi).
| Party | Votes | % | Swing | Seats | Change | ||
|---|---|---|---|---|---|---|---|
| Australian Labor Party | 4,702,296 | 34.73 | +1.35 | 69 | |||
| Coalition | |||||||
| Liberal Party of Australia | 3,882,905 | 28.67 | −3.35 | 45 | |||
| Liberal National Party (QLD) | 1,153,736 | 8.52 | −0.40 | 21 | |||
| National Party of Australia | 624,555 | 4.61 | +0.32 | 10 | |||
| Country Liberal Party (NT) | 32,409 | 0.24 | −0.08 | 0 | |||
| Australian Greens | 1,385,650 | 10.23 | +1.58 | 1 | |||
| Nick Xenophon Team | 250,333 | 1.85 | +1.85 | 1 | |||
| Family First Party | 201,222 | 1.49 | +0.08 | ||||
| Christian Democratic Party | 178,026 | 1.31 | +0.62 | ||||
| Pauline Hanson's One Nation | 175,020 | 1.29 | +1.12 | ||||
| Animal Justice Party | 94,516 | 0.70 | +0.69 | ||||
| Katter's Australian Party | 72,879 | 0.54 | −0.50 | 1 | |||
| Rise Up Australia Party | 68,418 | 0.51 | +0.13 | ||||
| Liberal Democratic Party | 66,261 | 0.49 | +0.45 | ||||
| Australian Christians | 43,150 | 0.32 | −0.01 | ||||
| Australian Liberty Alliance | 25,337 | 0.19 | +0.19 | ||||
| Drug Law Reform Australia | 20,350 | 0.15 | +0.15 | ||||
| Derryn Hinch's Justice Party | 16,885 | 0.12 | +0.12 | ||||
| Shooters, Fishers and Farmers Party | 15,477 | 0.11 | +0.11 | ||||
| Science Party | 14,988 | 0.11 | +0.10 | ||||
| Bullet Train for Australia | 14,078 | 0.10 | −0.05 | ||||
| Australian Sex Party | 12,683 | 0.09 | −0.52 | ||||
| Australian Recreational Fishers Party | 11,254 | 0.08 | +0.08 | ||||
| Glenn Lazarus Team | 10,094 | 0.07 | +0.07 | ||||
| Renewable Energy Party | 8,642 | 0.06 | +0.06 | ||||
| Online Direct Democracy | 8,511 | 0.06 | +0.06 | ||||
| Australian Country Party | 7,033 | 0.05 | +0.01 | ||||
| Australia First Party | 6,895 | 0.05 | −0.01 | ||||
| Arts Party | 6,821 | 0.05 | +0.05 | ||||
| Mature Australia Party | 5,888 | 0.04 | +0.04 | ||||
| Citizens Electoral Council | 5,175 | 0.04 | −0.04 | ||||
| Australian Defence Veterans Party | 4,360 | 0.03 | +0.03 | ||||
| Non-Custodial Parents Party | 3,663 | 0.03 | +0.02 | ||||
| Socialist Alliance | 3,653 | 0.03 | −0.01 | ||||
| CountryMinded | 3,478 | 0.03 | +0.03 | ||||
| Australian Equality Party (Marriage) | 3,296 | 0.02 | +0.02 | ||||
| Democratic Labour Party | 3,166 | 0.02 | −0.26 | ||||
| Outdoor Recreation Party (Stop The Greens) | 2,375 | 0.02 | +0.02 | ||||
| Consumer Rights & No-Tolls | 2,050 | 0.02 | +0.02 | ||||
| Socialist Equality Party | 1,608 | 0.01 | +0.01 | ||||
| Australian Antipaedophile Party | 1,527 | 0.01 | +0.01 | ||||
| Smokers' Rights Party | 1,343 | 0.01 | +0.01 | ||||
| Pirate Party Australia | 1,260 | 0.01 | +0.01 | ||||
| HEMP Party | 1,143 | 0.01 | +0.01 | ||||
| Voluntary Euthanasia Party | 973 | 0.01 | +0.01 | ||||
| Australian Cyclists Party | 846 | 0.01 | +0.01 | ||||
| Sustainable Australia | 606 | 0.00 | −0.03 | ||||
| Palmer United Party | 315 | 0.00 | −5.49 | 0 | |||
| Australian Progressives | 282 | 0.00 | +0.00 | ||||
| Independents | 380,712 | 2.81 | +1.44 | 2 | |||
| Non Affiliated | 2,958 | 0.02 | −0.02 | ||||
| Total | 13,541,101 | 150 | |||||
| Two-party-preferred vote | |||||||
| Liberal/National Coalition | 6,818,824 | 50.36 | −3.13 | 76 | |||
| Australian Labor Party | 6,722,277 | 49.64 | +3.13 | 69 | |||
| Invalid/blank votes | 131,722 | 4.70 | −0.86 | ||||
| Total votes | 14,262,016 | ||||||
| Registered voters/turnout | 15,671,551 | 91.01 | –2.22 | ||||
| Source: Federal Election 2016 | |||||||

New South Wales edit
| ||||||||||||||||||||||||||||||||||
All 47 New South Wales seats in the Australian House of Representatives and all 12 seats in the Australian Senate | ||||||||||||||||||||||||||||||||||
|---|---|---|---|---|---|---|---|---|---|---|---|---|---|---|---|---|---|---|---|---|---|---|---|---|---|---|---|---|---|---|---|---|---|---|
| ||||||||||||||||||||||||||||||||||


| ||||||||||||||||||||||||||||||||||


Liberal to Labor: Barton, Dobell, Eden-Monaro, Lindsay, Macarthur, Macquarie, Paterson
Victoria edit
| |||||||||||||||||||||||||||||||||||||||||||||
All 37 Victorian seats in the Australian House of Representatives and all 12 seats in the Australian Senate | |||||||||||||||||||||||||||||||||||||||||||||
|---|---|---|---|---|---|---|---|---|---|---|---|---|---|---|---|---|---|---|---|---|---|---|---|---|---|---|---|---|---|---|---|---|---|---|---|---|---|---|---|---|---|---|---|---|---|
| |||||||||||||||||||||||||||||||||||||||||||||

| |||||||||||||||||||||||||||||||||||||||||||||

Labor to Liberal: Chisholm
Liberal to National: Murray
Queensland edit
| |||||||||||||||||||||||||||||||||||||||||||||||||||||
All 30 Queensland seats in the Australian House of Representatives and all 12 seats in the Australian Senate | |||||||||||||||||||||||||||||||||||||||||||||||||||||
|---|---|---|---|---|---|---|---|---|---|---|---|---|---|---|---|---|---|---|---|---|---|---|---|---|---|---|---|---|---|---|---|---|---|---|---|---|---|---|---|---|---|---|---|---|---|---|---|---|---|---|---|---|---|
| |||||||||||||||||||||||||||||||||||||||||||||||||||||


| |||||||||||||||||||||||||||||||||||||||||||||||||||||


| Party | Votes | % | Swing | Seats | Change | |
|---|---|---|---|---|---|---|
| Liberal National Party | 1,153,736 | 43.19 | –2.47 | 21 | ||
| Australian Labor Party | 825,627 | 30.91 | +1.14 | 8 | ||
| Australian Greens | 235,887 | 8.83 | +2.61 | |||
| Pauline Hanson's One Nation | 147,478 | 5.52 | +5.42 | |||
| Family First Party | 103,933 | 3.89 | +1.85 | |||
| Katter's Australian Party | 72,879 | 2.73 | –1.02 | 1 | 0 | |
| Liberal Democratic Party | 25,665 | 0.96 | +0.96 | |||
| Australian Liberty Alliance | 12,320 | 0.46 | +0.46 | |||
| Nick Xenophon Team | 11,032 | 0.41 | +0.41 | |||
| Glenn Lazarus Team | 10,094 | 0.38 | +0.38 | |||
| Rise Up Australia Party | 4,490 | 0.17 | –0.22 | |||
| Drug Law Reform Australia | 4,466 | 0.17 | +0.17 | |||
| Australian Defence Veterans Party | 2,912 | 0.11 | +0.11 | |||
| CountryMinded | 2,141 | 0.08 | +0.08 | |||
| Consumer Rights & No-Tolls | 2,050 | 0.08 | +0.08 | |||
| Democratic Labour Party | 1,566 | 0.06 | +0.02 | |||
| The Arts Party | 1,467 | 0.05 | +0.05 | |||
| Online Direct Democracy | 1,062 | 0.04 | +0.04 | |||
| Mature Australia Party | 902 | 0.03 | +0.02 | |||
| Palmer United Party | 315 | 0.01 | −11.01 | 0 | ||
| Independent | 50,377 | 1.89 | +1.51 | |||
| Non Affiliated | 830 | 0.03 | −0.12 | |||
| Total | 2,671,229 | 30 | ||||
| Two-party-preferred vote | ||||||
| Liberal National Party | 1,445,030 | 54.10 | −2.88 | 21 | ||
| Australian Labor Party | 1,226,199 | 45.90 | +2.88 | 8 | ||
Liberal National to Labor: Herbert, Longman
Palmer to Liberal National: Fairfax
Western Australia edit
| ||||||||||||||||||||||||||||||||||
All 16 Western Australian seats in the Australian House of Representatives and all 12 seats in the Australian Senate | ||||||||||||||||||||||||||||||||||
|---|---|---|---|---|---|---|---|---|---|---|---|---|---|---|---|---|---|---|---|---|---|---|---|---|---|---|---|---|---|---|---|---|---|---|
| ||||||||||||||||||||||||||||||||||


| ||||||||||||||||||||||||||||||||||
| Party | Votes | % | Swing | Seats | Change | |
|---|---|---|---|---|---|---|
| Liberal Party of Australia | 611,605 | 45.70 | –1.61 | 11 | ||
| Australian Labor Party | 434,318 | 32.45 | +3.69 | 5 | ||
| Australian Greens | 161,443 | 12.06 | +2.32 | |||
| National Party of Australia | 40,160 | 3.00 | −0.90 | |||
| Australian Christians | 34,197 | 2.56 | +0.53 | |||
| Rise Up Australia Party | 20,859 | 1.56 | +0.84 | |||
| Shooters, Fishers and Farmers Party | 6,022 | 0.45 | +0.45 | |||
| Mature Australia Party | 3,203 | 0.24 | +0.24 | |||
| Liberal Democratic Party | 2,526 | 0.19 | +0.19 | |||
| Outdoor Recreation Party | 2,375 | 0.18 | +0.18 | |||
| Australian Liberty Alliance | 1,544 | 0.10 | +0.10 | |||
| Socialist Alliance | 1,404 | 0.10 | +0.04 | |||
| Online Direct Democracy | 1,300 | 0.10 | +0.10 | |||
| Independent | 17,381 | 1.30 | +1.03 | |||
| Total | 1,338,337 | 16 | ||||
| Two-party-preferred vote | ||||||
| Liberal Party of Australia | 731,497 | 54.66 | −3.62 | 11 | ||
| Australian Labor Party | 606,840 | 45.34 | +3.62 | 5 | ||
South Australia edit
| |||||||||||||||||||||||||||||||||||||||||||||||||
All 11 South Australian seats in the Australian House of Representatives and all 12 seats in the Australian Senate | |||||||||||||||||||||||||||||||||||||||||||||||||
|---|---|---|---|---|---|---|---|---|---|---|---|---|---|---|---|---|---|---|---|---|---|---|---|---|---|---|---|---|---|---|---|---|---|---|---|---|---|---|---|---|---|---|---|---|---|---|---|---|---|
| |||||||||||||||||||||||||||||||||||||||||||||||||


| |||||||||||||||||||||||||||||||||||||||||||||||||
| Party | Votes | % | Swing | Seats | Change | |
|---|---|---|---|---|---|---|
| Liberal Party of Australia | 365,155 | 35.09 | –9.40 | 4 | ||
| Australian Labor Party | 328,314 | 31.55 | –4.18 | 6 | ||
| Nick Xenophon Team | 221,210 | 21.26 | +21.26 | 1 | ||
| Australian Greens | 64,605 | 6.21 | −2.07 | |||
| Family First Party | 40,941 | 3.93 | −1.48 | |||
| Animal Justice Party | 8,881 | 0.85 | +0.85 | |||
| Liberal Democratic Party | 2,178 | 0.21 | +0.21 | |||
| Christian Democratic Party | 1,715 | 0.16 | +0.16 | |||
| Independent | 7,737 | 0.74 | −0.54 | |||
| Total | 1,040,736 | 11 | ||||
| Two-party-preferred vote | ||||||
| Australian Labor Party | 544,017 | 52.27 | +4.63 | 6 | ||
| Liberal Party of Australia | 496,719 | 47.73 | −4.63 | 4 | ||
Liberal to Labor: Hindmarsh
Liberal to Xenophon: Mayo
Tasmania edit
| ||||||||||||||||||||||||||||||||||
All 5 Tasmanian seats in the Australian House of Representatives and all 12 seats in the Australian Senate | ||||||||||||||||||||||||||||||||||
|---|---|---|---|---|---|---|---|---|---|---|---|---|---|---|---|---|---|---|---|---|---|---|---|---|---|---|---|---|---|---|---|---|---|---|
| ||||||||||||||||||||||||||||||||||
 | ||||||||||||||||||||||||||||||||||
This is a list of electoral division results for the 2016 Australian federal election in the state of Tasmania.
| Party | Votes | % | Swing | Seats | Change | |||
|---|---|---|---|---|---|---|---|---|
| Australian Labor Party | 127,186 | 37.90 | +3.09 | 4 | ||||
| Liberal Party of Australia | 118,956 | 35.44 | –4.82 | 0 | ||||
| Australian Greens | 34,291 | 10.22 | +1.90 | |||||
| Australian Recreational Fishers Party | 11,254 | 3.35 | +3.35 | |||||
| Christian Democratic Party | 6,345 | 1.89 | +1.89 | |||||
| Renewable Energy Party | 4,534 | 1.35 | +1.35 | |||||
| The Arts Party | 1,673 | 0.50 | +0.50 | |||||
| Liberal Democratic Party | 1,380 | 0.41 | +0.41 | |||||
| Democratic Labour Party | 632 | 0.19 | +0.02 | |||||
| Independent | 29,372 | 8.75 | +1.28 | 1 | ||||
| Total | 335,623 | 5 | ||||||
| Two-party-preferred vote | ||||||||
| Australian Labor Party | 192,530 | 57.36 | +6.13 | 4 | ||||
| Liberal Party of Australia | 143,093 | 42.64 | −6.13 | 0 | ||||
Territories edit
Australian Capital Territory edit
| ||||||||||||||||||||||||||||
All 2 Australian Capital Territory seats in the Australian House of Representatives and all 2 seats in the Australian Senate | ||||||||||||||||||||||||||||
|---|---|---|---|---|---|---|---|---|---|---|---|---|---|---|---|---|---|---|---|---|---|---|---|---|---|---|---|---|
| ||||||||||||||||||||||||||||
 | ||||||||||||||||||||||||||||
| Party | Votes | % | Swing | Seats | Change | |
|---|---|---|---|---|---|---|
| Australian Labor Party | 111,887 | 44.27 | +1.34 | 2 | ||
| Liberal Party of Australia | 87,346 | 34.56 | –0.06 | 0 | ||
| Australian Greens | 38,129 | 15.09 | +1.69 | |||
| Bullet Train for Australia | 10,673 | 4.22 | +0.14 | |||
| Independent | 4,707 | 1.86 | +1.86 | |||
| Total | 252,742 | 2 | ||||
| Two-party-preferred vote | ||||||
| Australian Labor Party | 154,489 | 61.13 | +1.22 | 2 | 0 | |
| Liberal Party of Australia | 98,253 | 38.87 | −1.22 | 0 | 0 | |
Northern Territory edit
| ||||||||||||||||||||||||||||
All 2 Northern Territory seats in the Australian House of Representatives and all 2 seats in the Australian Senate | ||||||||||||||||||||||||||||
|---|---|---|---|---|---|---|---|---|---|---|---|---|---|---|---|---|---|---|---|---|---|---|---|---|---|---|---|---|
| ||||||||||||||||||||||||||||
 | ||||||||||||||||||||||||||||
| Party | Votes | % | Swing | Seats | Change | |
|---|---|---|---|---|---|---|
| Australian Labor Party | 39,364 | 40.39 | +2.96 | 2 | ||
| Country Liberal Party | 32,409 | 33.25 | –8.45 | 0 | ||
| Australian Greens | 8,858 | 9.09 | +1.20 | |||
| Shooters, Fishers and Farmers Party | 4,584 | 4.70 | +4.70 | |||
| Rise Up Australia Party | 2,483 | 2.55 | +1.10 | |||
| Liberal Democratic Party | 1,275 | 1.31 | +1.31 | |||
| Help End Marijuana Prohibition (HEMP) Party | 1,143 | 1.17 | +1.17 | |||
| Australia First Party | 798 | 0.82 | +0.82 | |||
| Citizens Electoral Council | 444 | 0.46 | −1.41 | |||
| Online Direct Democracy | 369 | 0.38 | +0.38 | |||
| Independent | 5,733 | 5.88 | +5.13 | |||
| Total | 97,460 | 2 | ||||
| Two-party-preferred vote | ||||||
| Australian Labor Party | 55,614 | 57.06 | +7.41 | 2 | ||
| Country Liberal Party | 41,846 | 42.94 | −7.41 | 0 | ||
Country Liberal to Labor: Solomon
Two party preferred preference flow edit
| Party | Liberal National coalition | Labor Party | |||||||
|---|---|---|---|---|---|---|---|---|---|
| Votes | % | ± | Votes | % | ± | ||||
| Greens | 250,263 | 18.06% | +1.09 | 1,135,387 | 81.94% | –1.09 | |||
| One Nation | 88,327 | 50.47% | –4.63 | 86,693 | 49.53% | +4.63 | |||
| United Australia Party | 117 | 37.14% | –16.53 | 198 | 62.86% | +16.53 | |||
| Liberal Democratic Party | 46,458 | 70.11% | –9.45 | 19,803 | 29.89% | +9.45 | |||
| Christian Democratic Party | 129,463 | 72.72% | +1.21 | 48,563 | 27.28% | –1.21 | |||
| Democratic Labour Party | 1,132 | 35.75% | –7.76 | 2,034 | 64.25% | +7.76 | |||
| Rise Up Australia Party | 36,239 | 52.97% | –7.26 | 32,179 | 47.03% | +7.26 | |||
| Australia First Party | 3,161 | 45.84% | –13.89 | 3,734 | 54.16% | +13.89 | |||
| Animal Justice Party | 35,204 | 37.25% | +5.62 | 59,312 | 62.75% | –5.62 | |||
| Australian Federation Party | |||||||||
| Katter's Australian | 38,656 | 53.04% | –0.96 | 34,223 | 46.96% | +0.96 | |||
| Centre Alliance | 99,564 | 39.77% | – | 150,769 | 60.23% | – | |||
| Australian Christians | 31,186 | 72.27% | +2.22 | 11,964 | 27.73% | –2.22 | |||
| Australian Liberty Alliance | 17,294 | 68.26% | – | 8,043 | 31.74% | – | |||
| Shooters, Fishers and Farmers Party | 7,090 | 45.81% | – | 8,387 | 54.19% | – | |||
| Socialist Alliance | 948 | 25.95% | +6.95 | 2,705 | 74.05% | –6.95 | |||
| Derryn Hinch's Justice Party | 8,276 | 49.01% | – | 8,609 | 50.99% | – | |||
| Australian Citizens Party | 2,715 | 52.46% | +3.08 | 2,460 | 47.54% | –3.08 | |||
| Sustainable Australia | 312 | 51.49% | – | 294 | 48.51% | – | |||
| Reason Party | 2,776 | 31.21% | – | 6,119 | 68.79% | – | |||
| Independents | 194,826 | 40.60% | –2.30 | 285,010 | 59.40% | +2.30 | |||
| Total | 14,659,042 | 100.00 | 151 | ||||||
| Two-party-preferred vote | |||||||||
| Liberal/National Coalition | 6,818,824 | 50.36% | −3.13 | ||||||
| Labor | 6,722,277 | 49.64% | +3.13 | ||||||
| Invalid/blank votes | 802,376 | 5.19% | –0.35 | – | – | – | |||
| Turnout | 15,461,418 | 89.82% | –2.07 | – | – | – | |||
| Registered voters | 17,213,433 | – | – | – | – | – | |||
| Source: AEC for both votes | |||||||||
Maps edit
Results by electoral division edit
-
 First preference vote
 -
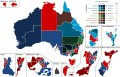 Two-candidate-preferred vote


Results by state and territory edit
-
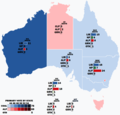 First preference vote and seat totals

See also edit
References edit
- ^ Members Elected, AEC
- ^ Barber, Stephen (7 April 2017). "Federal Election 2016" (PDF). Research Paper 2016–17. Parliamentary Library. ISSN 2203-5249.
- ^ "First preferences by party". Australian Electoral Commission. Retrieved 28 May 2022.
- ^ "House Party Representation Leading". aec.gov.au. Retrieved 24 June 2022.