
KNOWPIA
WELCOME TO KNOWPIA

Rivarennes, Indre-et-Loire 
Summary
Rivarennes (French pronunciation: [ʁivaʁɛn] ⓘ) is a commune in the Indre-et-Loire department in central France.
Rivarennes | |
|---|---|
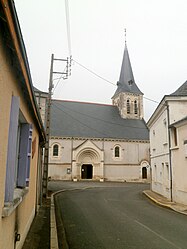 Church in Rivarennes | |
Location of Rivarennes .mw-parser-output .locmap .od{position:absolute}.mw-parser-output .locmap .id{position:absolute;line-height:0}.mw-parser-output .locmap .l0{font-size:0;position:absolute}.mw-parser-output .locmap .pv{line-height:110%;position:absolute;text-align:center}.mw-parser-output .locmap .pl{line-height:110%;position:absolute;top:-0.75em;text-align:right}.mw-parser-output .locmap .pr{line-height:110%;position:absolute;top:-0.75em;text-align:left}.mw-parser-output .locmap .pv>div{display:inline;padding:1px}.mw-parser-output .locmap .pl>div{display:inline;padding:1px;float:right}.mw-parser-output .locmap .pr>div{display:inline;padding:1px;float:left}html.skin-theme-clientpref-night .mw-parser-output .od,html.skin-theme-clientpref-night .mw-parser-output .od .pv>div,html.skin-theme-clientpref-night .mw-parser-output .od .pl>div,html.skin-theme-clientpref-night .mw-parser-output .od .pr>div{background:#000;color:#fff}html.skin-theme-clientpref-night .mw-parser-output .locmap{filter:grayscale(0.6)}@media(prefers-color-scheme:dark){html.skin-theme-clientpref-os .mw-parser-output .locmap{filter:grayscale(0.6)}html.skin-theme-clientpref-os .mw-parser-output .od,html.skin-theme-clientpref-os .mw-parser-output .od .pv>div,html.skin-theme-clientpref-os .mw-parser-output .od .pl>div,html.skin-theme-clientpref-os .mw-parser-output .od .pr>div{background:#000;color:#fff}}  Rivarennes  Rivarennes | |
| Coordinates: 47°16′02″N 0°21′17″E / 47.2672°N 0.3547°E | |
| Country | France |
| Region | Centre-Val de Loire |
| Department | Indre-et-Loire |
| Arrondissement | Tours |
| Canton | Chinon |
| Government | |
| • Mayor (2020–2026) | Agnès Bureau[1] |
| Area 1 | 18.92 km2 (7.31 sq mi) |
| Population (2021)[2] | 985 |
| • Density | 52/km2 (130/sq mi) |
| Time zone | UTC+01:00 (CET) |
| • Summer (DST) | UTC+02:00 (CEST) |
| INSEE/Postal code | 37200 /37190 |
| Elevation | 36–121 m (118–397 ft) |
| 1 French Land Register data, which excludes lakes, ponds, glaciers > 1 km2 (0.386 sq mi or 247 acres) and river estuaries. | |
Population edit
| Year | Pop. | ±% p.a. |
|---|---|---|
| 1968 | 725 | — |
| 1975 | 723 | −0.04% |
| 1982 | 687 | −0.73% |
| 1990 | 712 | +0.45% |
| 1999 | 713 | +0.02% |
| 2007 | 880 | +2.67% |
| 2012 | 1,030 | +3.20% |
| 2017 | 1,004 | −0.51% |
| Source: INSEE[3] | ||
See also edit
References edit
- ^ "Répertoire national des élus: les maires" (in French). data.gouv.fr, Plateforme ouverte des données publiques françaises. 13 September 2022.
- ^ "Populations légales 2021". The National Institute of Statistics and Economic Studies. 28 December 2023.
- ^ Population en historique depuis 1968, INSEE
Wikimedia Commons has media related to Rivarennes (Indre-et-Loire).