


Summary
Russin is a municipality in the canton of Geneva in Switzerland.
Russin | |
|---|---|
 | |
 Coat of arms | |
Location of Russin .mw-parser-output .locmap .od{position:absolute}.mw-parser-output .locmap .id{position:absolute;line-height:0}.mw-parser-output .locmap .l0{font-size:0;position:absolute}.mw-parser-output .locmap .pv{line-height:110%;position:absolute;text-align:center}.mw-parser-output .locmap .pl{line-height:110%;position:absolute;top:-0.75em;text-align:right}.mw-parser-output .locmap .pr{line-height:110%;position:absolute;top:-0.75em;text-align:left}.mw-parser-output .locmap .pv>div{display:inline;padding:1px}.mw-parser-output .locmap .pl>div{display:inline;padding:1px;float:right}.mw-parser-output .locmap .pr>div{display:inline;padding:1px;float:left}html.skin-theme-clientpref-night .mw-parser-output .od,html.skin-theme-clientpref-night .mw-parser-output .od .pv>div,html.skin-theme-clientpref-night .mw-parser-output .od .pl>div,html.skin-theme-clientpref-night .mw-parser-output .od .pr>div{background:#000;color:#fff}html.skin-theme-clientpref-night .mw-parser-output .locmap{filter:grayscale(0.6)}@media(prefers-color-scheme:dark){html.skin-theme-clientpref-os .mw-parser-output .locmap{filter:grayscale(0.6)}html.skin-theme-clientpref-os .mw-parser-output .od,html.skin-theme-clientpref-os .mw-parser-output .od .pv>div,html.skin-theme-clientpref-os .mw-parser-output .od .pl>div,html.skin-theme-clientpref-os .mw-parser-output .od .pr>div{background:#000;color:#fff}}  Russin  Russin | |
| Coordinates: 46°11′N 06°01′E / 46.183°N 6.017°E | |
| Country | Switzerland |
| Canton | Geneva |
| District | n.a. |
| Government | |
| • Mayor | Maire Patrice Plojoux |
| Area | |
| • Total | 4.91 km2 (1.90 sq mi) |
| Elevation | 410 m (1,350 ft) |
| Population (31 December 2018)[2] | |
| • Total | 541 |
| • Density | 110/km2 (290/sq mi) |
| Time zone | UTC+01:00 (Central European Time) |
| • Summer (DST) | UTC+02:00 (Central European Summer Time) |
| Postal code(s) | 1281 |
| SFOS number | 6637 |
| ISO 3166 code | CH-GE |
| Surrounded by | Aire-la-Ville, Avully, Cartigny, Dardagny, Satigny |
| Website | www SFSO statistics |
History edit
Russin is first mentioned around 1100 as Russino und Rucins. In 1217 it was mentioned as Russins.[3]
Geography edit
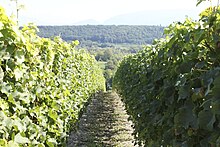
Russin has an area, as of 2009[update], of 4.91 square kilometers (1.90 sq mi). Of this area, 2.63 km2 (1.02 sq mi) or 53.6% is used for agricultural purposes, while 1.04 km2 (0.40 sq mi) or 21.2% is forested. Of the rest of the land, 0.67 km2 (0.26 sq mi) or 13.6% is settled (buildings or roads), 0.42 km2 (0.16 sq mi) or 8.6% is either rivers or lakes and 0.19 km2 (0.073 sq mi) or 3.9% is unproductive land.[4]
Of the built up area, housing and buildings made up 2.4% and transportation infrastructure made up 5.9%. Power and water infrastructure as well as other special developed areas made up 5.1% of the area Out of the forested land, 19.1% of the total land area is heavily forested and 2.0% is covered with orchards or small clusters of trees. Of the agricultural land, 24.6% is used for growing crops and 6.1% is pastures, while 22.8% is used for orchards or vine crops. Of the water in the municipality, 1.2% is in lakes and 7.3% is in rivers and streams.[4]
The municipality is located on the right bank of the Rhone river. It consists of the village of Russin and the hamlets of Verbois, La Chaumaz and Les Baillets.
The municipality of Russin consists of the sub-sections or villages of Molards, Russin - plateau, Verbois, Teppes-du-Biolay and Russin - village.[5]
Demographics edit

Russin has a population (as of December 2020[update]) of 530.[6] As of 2008[update], 23.8% of the population are resident foreign nationals.[7] Over the last 10 years (1999–2009 ) the population has changed at a rate of 16.6%. It has changed at a rate of 14.3% due to migration and at a rate of 6% due to births and deaths.[8]
Most of the population (as of 2000[update]) speaks French (340 or 86.7%), with German being second most common (15 or 3.8%) and Portuguese being third (9 or 2.3%). There are 4 people who speak Italian.[9]
As of 2008[update], the gender distribution of the population was 51.4% male and 48.6% female. The population was made up of 182 Swiss men (38.8% of the population) and 59 (12.6%) non-Swiss men. There were 165 Swiss women (35.2%) and 63 (13.4%) non-Swiss women.[10] Of the population in the municipality 105 or about 26.8% were born in Russin and lived there in 2000. There were 123 or 31.4% who were born in the same canton, while 52 or 13.3% were born somewhere else in Switzerland, and 93 or 23.7% were born outside of Switzerland.[9]
In 2008[update] there were 4 live births to Swiss citizens and 3 births to non-Swiss citizens, and in same time span there . Ignoring immigration and emigration, the population of Swiss citizens increased by 4 while the foreign population increased by 3. There were 4 Swiss men and 1 Swiss woman who emigrated from Switzerland. At the same time, there was 1 non-Swiss man and 5 non-Swiss women who immigrated from another country to Switzerland. The total Swiss population change in 2008 (from all sources, including moves across municipal borders) was an increase of 1 and the non-Swiss population increased by 6 people. This represents a population growth rate of 1.8%.[7]
The age distribution of the population (as of 2000[update]) is children and teenagers (0–19 years old) make up 25.5% of the population, while adults (20–64 years old) make up 62.2% and seniors (over 64 years old) make up 12.2%.[8]
As of 2000[update], there were 160 people who were single and never married in the municipality. There were 196 married individuals, 17 widows or widowers and 19 individuals who are divorced.[9]
As of 2000[update], there were 155 private households in the municipality, and an average of 2.4 persons per household.[8] There were 42 households that consist of only one person and 14 households with five or more people. Out of a total of 163 households that answered this question, 25.8% were households made up of just one person and there was 1 adult who lived with their parents. Of the rest of the households, there are 49 married couples without children, 52 married couples with children There were 8 single parents with a child or children. There were 3 households that were made up of unrelated people and 8 households that were made up of some sort of institution or another collective housing.[9]
In 2000[update] there were 77 single family homes (or 61.6% of the total) out of a total of 125 inhabited buildings. There were 14 multi-family buildings (11.2%), along with 23 multi-purpose buildings that were mostly used for housing (18.4%) and 11 other use buildings (commercial or industrial) that also had some housing (8.8%). Of the single family homes 32 were built before 1919, while 6 were built between 1990 and 2000. The most multi-family homes (7) were built before 1919 and the next most (3) were built between 1961 and 1970. There were 2 multi-family houses built between 1996 and 2000.[11]
In 2000[update] there were 162 apartments in the municipality. The most common apartment size was 4 rooms of which there were 43. There were 9 single room apartments and 53 apartments with five or more rooms. Of these apartments, a total of 144 apartments (88.9% of the total) were permanently occupied, while 10 apartments (6.2%) were seasonally occupied and 8 apartments (4.9%) were empty.[11] As of 2009[update], the construction rate of new housing units was 56 new units per 1000 residents.[8] The vacancy rate for the municipality, in 2010[update], was 0%.[8]
The historical population is given in the following chart:[3][12]

Heritage sites of national significance edit
The Campagne De La Grand’Cour is listed as a Swiss heritage site of national significance.[13]
Politics edit
In the 2007 federal election the most popular party was the SVP which received 21.38% of the vote. The next three most popular parties were the Green Party (20.25%), the FDP (19.06%) and the SP (9.59%). In the federal election, a total of 152 votes were cast, and the voter turnout was 64.1%.[14]
In the 2009 Grand Conseil election, there were a total of 265 registered voters of which 133 (50.2%) voted. The most popular party in the municipality for this election was the Les Radicaux with 18.9% of the ballots. In the canton-wide election they received the sixth highest proportion of votes. The second most popular party was the Les Verts (with 18.2%), they were also second in the canton-wide election, while the third most popular party was the Libéral (with 12.9%), they were first in the canton-wide election.[15]
For the 2009 Conseil d'Etat election, there were a total of 265 registered voters of which 162 (61.1%) voted.[15]
In 2011, all the municipalities held local elections, and in Russin there were 9 spots open on the municipal council. There were a total of 324 registered voters of which 229 (70.7%) voted. Out of the 229 votes, there were 1 blank votes, 118 votes with a name that was not on the list.[15]
Economy edit
As of 2010[update], Russin had an unemployment rate of 3.2%. As of 2008[update], there were 32 people employed in the primary economic sector and about 9 businesses involved in this sector. 49 people were employed in the secondary sector and there were 5 businesses in this sector. 27 people were employed in the tertiary sector, with 11 businesses in this sector.[8] There were 204 residents of the municipality who were employed in some capacity, of which females made up 40.2% of the workforce.
In 2008[update] the total number of full-time equivalent jobs was 91. The number of jobs in the primary sector was 19, all of which were in agriculture. The number of jobs in the secondary sector was 48 of which 2 or (4.2%) were in manufacturing and 5 (10.4%) were in construction. The number of jobs in the tertiary sector was 24. In the tertiary sector; 8 or 33.3% were in wholesale or retail sales or the repair of motor vehicles, 10 or 41.7% were in a hotel or restaurant, 2 or 8.3% were technical professionals or scientists, 3 or 12.5% were in education.[16]
In 2000[update], there were 46 workers who commuted into the municipality and 131 workers who commuted away. The municipality is a net exporter of workers, with about 2.8 workers leaving the municipality for every one entering.[17] Of the working population, 15.2% used public transportation to get to work, and 53.4% used a private car.[8]
Religion edit
From the 2000 census[update], 169 or 43.1% belonged to the Swiss Reformed Church, while 86 or 21.9% were Roman Catholic. Of the rest of the population, there were four individuals (or about 1.02% of the population) who belonged to the Christian Catholic Church, and there were six individuals (or about 1.53% of the population) who belonged to another Christian church. There were two people who were Muslim, one who was Buddhist and one individual who belonged to another church. 92 (or about 23.47% of the population) belonged to no church, are agnostic or atheist, and 31 individuals (or about 7.91% of the population) did not answer the question.[9]
Education edit
In Russin about 133 or (33.9%) of the population have completed non-mandatory upper secondary education, and 87 or (22.2%) have completed additional higher education (either university or a Fachhochschule). Of the 87 who completed tertiary schooling, 51.7% were Swiss men, 28.7% were Swiss women, 6.9% were non-Swiss men and 12.6% were non-Swiss women.[9]
During the 2009-2010 school year there were a total of 85 students in the Russin school system. The education system in the Canton of Geneva allows young children to attend two years of non-obligatory Kindergarten.[18] During that school year, there were 4 children who were in a pre-kindergarten class. The canton's school system provides two years of non-mandatory kindergarten and requires students to attend six years of primary school, with some of the children attending smaller, specialized classes. In Russin there were 16 students in kindergarten or primary school and - students were in the special, smaller classes. The secondary school program consists of three lower, obligatory years of schooling, followed by three to five years of optional, advanced schools. There were 16 lower secondary students who attended school in Russin. There were 29 upper secondary students from the municipality along with 4 students who were in a professional, non-university track program. An additional 3 students attended a private school.[19]
As of 2000[update], there were 21 students in Russin who came from another municipality, while 52 residents attended schools outside the municipality.[17]
Transportation edit
The municipality has a railway station, Russin, on the Lyon–Geneva line. It has regular service to La Plaine, Bellegarde, and Geneva.
References edit
- ^ a b "Arealstatistik Standard - Gemeinden nach 4 Hauptbereichen". Federal Statistical Office. Retrieved 13 January 2019.
- ^ "Ständige Wohnbevölkerung nach Staatsangehörigkeitskategorie Geschlecht und Gemeinde; Provisorische Jahresergebnisse; 2018". Federal Statistical Office. 9 April 2019. Retrieved 11 April 2019.
- ^ a b Russin in German, French and Italian in the online Historical Dictionary of Switzerland.
- ^ a b Swiss Federal Statistical Office-Land Use Statistics 2009 data (in German) accessed 25 March 2010
- ^ Canton of Geneva Statistical Office Liste des 475 sous-secteurs statistiques du canton de Genève. (in French) accessed 18 April 2011
- ^ "Ständige und nichtständige Wohnbevölkerung nach institutionellen Gliederungen, Geburtsort und Staatsangehörigkeit". bfs.admin.ch (in German). Swiss Federal Statistical Office - STAT-TAB. 31 December 2020. Retrieved 21 September 2021.
- ^ a b Swiss Federal Statistical Office - Superweb database - Gemeinde Statistics 1981-2008 (in German) accessed 19 June 2010
- ^ a b c d e f g Swiss Federal Statistical Office accessed 29-April-2011
- ^ a b c d e f STAT-TAB Datenwürfel für Thema 40.3 - 2000 Archived 2014-04-09 at the Wayback Machine (in German) accessed 2 February 2011
- ^ Canton of Geneva Statistical Office Archived 2016-04-02 at the Wayback Machine Population résidante du canton de Genève, selon l'origine et le sexe, par commune, en mars 2011(in French) accessed 18 April 2011
- ^ a b Swiss Federal Statistical Office STAT-TAB - Datenwürfel für Thema 09.2 - Gebäude und Wohnungen Archived 2014-09-07 at the Wayback Machine (in German) accessed 28 January 2011
- ^ Swiss Federal Statistical Office STAT-TAB Bevölkerungsentwicklung nach Region, 1850-2000 Archived 2014-09-30 at the Wayback Machine (in German) accessed 29 January 2011
- ^ "Kantonsliste A-Objekte". KGS Inventar (in German). Federal Office of Civil Protection. 2009. Archived from the original on 28 June 2010. Retrieved 25 April 2011.
- ^ Swiss Federal Statistical Office, Nationalratswahlen 2007: Stärke der Parteien und Wahlbeteiligung, nach Gemeinden/Bezirk/Canton (in German) accessed 28 May 2010
- ^ a b c Canton of Geneva Statistical Office Election Results from multiple spreadsheets (in French) accessed 18 April 2011
- ^ Swiss Federal Statistical Office STAT-TAB Betriebszählung: Arbeitsstätten nach Gemeinde und NOGA 2008 (Abschnitte), Sektoren 1-3 Archived 2014-12-25 at the Wayback Machine (in German) accessed 28 January 2011
- ^ a b Swiss Federal Statistical Office - Statweb Archived 2012-08-04 at archive.today (in German) accessed 24 June 2010
- ^ EDK/CDIP/IDES (2010). Kantonale Schulstrukturen in der Schweiz und im Fürstentum Liechtenstein / Structures Scolaires Cantonales en Suisse et Dans la Principauté du Liechtenstein (PDF) (Report). Retrieved 24 June 2010.
- ^ Canton of Geneva Statistical Office Elèves résidant dans le canton de Genève, selon le niveau d'enseignement, par commune de domicile (in French) accessed 18 April 2011