


Summary
SDS-PAGE (sodium dodecyl sulfate–polyacrylamide gel electrophoresis) is a discontinuous electrophoretic system developed by Ulrich K. Laemmli which is commonly used as a method to separate proteins with molecular masses between 5 and 250 kDa.[1][2] The combined use of sodium dodecyl sulfate (SDS, also known as sodium lauryl sulfate) and polyacrylamide gel eliminates the influence of structure and charge, and proteins are separated by differences in their size. At least up to 2012, the publication describing it was the most frequently cited paper by a single author, and the second most cited overall.[3]
Properties edit
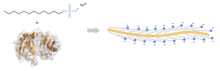

SDS-PAGE is an electrophoresis method that allows protein separation by mass. The medium (also referred to as ′matrix′) is a polyacrylamide-based discontinuous gel. The polyacrylamide-gel is typically sandwiched between two glass plates in a slab gel. Although tube gels (in glass cylinders) were used historically, they were rapidly made obsolete with the invention of the more convenient slab gels.[4] In addition, SDS (sodium dodecyl sulfate) is used. About 1.4 grams of SDS bind to a gram of protein,[5][6][7] corresponding to one SDS molecule per two amino acids. SDS acts as a surfactant, masking the protein's intrinsic charge and conferring them very similar charge-to-mass ratios. The intrinsic charges of the proteins are negligible in comparison to the SDS loading, and the positive charges are also greatly reduced in the basic pH range of a separating gel. Upon application of a constant electric field, the proteins migrate towards the anode, each with a different speed, depending on their mass. This simple procedure allows precise protein separation by mass.
SDS tends to form spherical micelles in aqueous solutions above a certain concentration called the critical micellar concentration (CMC). Above the critical micellar concentration of 7 to 10 millimolar in solutions, the SDS simultaneously occurs as single molecules (monomer) and as micelles, below the CMC SDS occurs only as monomers in aqueous solutions. At the critical micellar concentration, a micelle consists of about 62 SDS molecules.[8] However, only SDS monomers bind to proteins via hydrophobic interactions, whereas the SDS micelles are anionic on the outside and do not adsorb any protein.[5] SDS is amphipathic in nature, which allows it to unfold both polar and nonpolar sections of protein structure.[9] In SDS concentrations above 0.1 millimolar, the unfolding of proteins begins,[5] and above 1 mM, most proteins are denatured.[5] Due to the strong denaturing effect of SDS and the subsequent dissociation of protein complexes, quaternary structures can generally not be determined with SDS. Exceptions are proteins that are stabilised by covalent cross-linking (e.g. -S-S- linkages) and the SDS-resistant protein complexes, which are stable even in the presence of SDS (the latter, however, only at room temperature). To denature the SDS-resistant complexes a high activation energy is required, which is achieved by heating. SDS resistance is based on a metastability of the protein fold. Although the native, fully folded, SDS-resistant protein does not have sufficient stability in the presence of SDS, the chemical equilibrium of denaturation at room temperature occurs slowly. Stable protein complexes are characterised not only by SDS resistance but also by stability against proteases and an increased biological half-life.[10]
Alternatively, polyacrylamide gel electrophoresis can also be performed with the cationic surfactants CTAB in a CTAB-PAGE,[11][12][13] or 16-BAC in a BAC-PAGE.[14]
Procedure edit
The SDS-PAGE method is composed of gel preparation, sample preparation, electrophoresis, protein staining or western blotting and analysis of the generated banding pattern.
Gel production edit


When using different buffers in the gel (discontinuous gel electrophoresis), the gels are made up to one day prior to electrophoresis, so that the diffusion does not lead to a mixing of the buffers. The gel is produced by free radical polymerization in a mold consisting of two sealed glass plates with spacers between the glass plates. In a typical mini-gel setting, the spacers have a thickness of 0.75 mm or 1.5 mm, which determines the loading capacity of the gel. For pouring the gel solution, the plates are usually clamped in a stand which temporarily seals the otherwise open underside of the glass plates with the two spacers. For the gel solution, acrylamide is mixed as gel-former (usually 4% V/V in the stacking gel and 10-12 % in the separating gel), methylenebisacrylamide as a cross-linker, stacking or separating gel buffer, water and SDS. By adding the catalyst TEMED and the radical initiator ammonium persulfate (APS) the polymerisation is started. The solution is then poured between the glass plates without creating bubbles. Depending on the amount of catalyst and radical starter and depending on the temperature, the polymerisation lasts between a quarter of an hour and several hours. The lower gel (separating gel) is poured first and covered with a few drops of a barely water-soluble alcohol (usually buffer-saturated butanol or isopropanol), which eliminates bubbles from the meniscus and protects the gel solution of the radical scavenger oxygen. After the polymerisation of the separating gel, the alcohol is discarded and the residual alcohol is removed with filter paper. After addition of APS and TEMED to the stacking gel solution, it is poured on top of the solid separation gel. Afterwards, a suitable sample comb is inserted between the glass plates without creating bubbles. The sample comb is carefully pulled out after polymerisation, leaving pockets for the sample application. For later use of proteins for protein sequencing, the gels are often prepared the day before electrophoresis to reduce reactions of unpolymerised acrylamide with cysteines in proteins.
By using a gradient mixer, gradient gels with a gradient of acrylamide (usually from 4 to 12%) can be cast, which have a larger separation range of the molecular masses.[15] Commercial gel systems (so-called pre-cast gels) usually use the buffer substance Bis-tris methane with a pH value between 6.4 and 7.2 both in the stacking gel and in the separating gel.[16][17] These gels are delivered cast and ready-to-use. Since they use only one buffer (continuous gel electrophoresis) and have a nearly neutral pH, they can be stored for several weeks. The more neutral pH slows the hydrolysis and thus the decomposition of the polyacrylamide. Furthermore, there are fewer acrylamide-modified cysteines in the proteins.[16] Due to the constant pH in collecting and separating gel there is no stacking effect. Proteins in BisTris gels can not be stained with ruthenium complexes.[18] This gel system has a comparatively large separation range, which can be varied by using MES or MOPS in the running buffer.[16]
Sample preparation edit
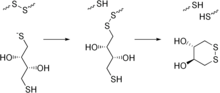
During sample preparation, the sample buffer, and thus SDS, is added in excess to the proteins, and the sample is then heated to 95 °C for five minutes, or alternatively 70 °C for ten minutes. Heating disrupts the secondary and tertiary structures of the protein by disrupting hydrogen bonds and stretching the molecules. Optionally, disulfide bridges can be cleaved by reduction. For this purpose, reducing thiols such as β-mercaptoethanol (β-ME, 5% by volume), dithiothreitol (DTT, 10 millimolar) or dithioerythritol (DTE, 10 millimolar) are added to the sample buffer. After cooling to room temperature, each sample is pipetted into its own well in the gel, which was previously immersed in electrophoresis buffer in the electrophoresis apparatus.
In addition to the samples, a molecular-weight size marker is usually loaded onto the gel. This consists of proteins of known sizes and thereby allows the estimation (with an error of ± 10%) of the sizes of the proteins in the actual samples, which migrate in parallel in different tracks of the gel.[19] The size marker is often pipetted into the first or last pocket of a gel.
Electrophoresis edit


For separation, the denatured samples are loaded onto a gel of polyacrylamide, which is placed in an electrophoresis buffer with suitable electrolytes. Thereafter, a voltage (usually around 100 V, 10-20 V per cm gel length) is applied, which causes a migration of negatively charged molecules through the gel in the direction of the positively charged anode. The gel acts like a sieve. Small proteins migrate relatively easily through the mesh of the gel, while larger proteins are more likely to be retained and thereby migrate more slowly through the gel, thereby allowing proteins to be separated by molecular size. The electrophoresis lasts between half an hour to several hours depending on the voltage and length of gel used.
The fastest-migrating proteins (with a molecular weight of less than 5 kDa) form the buffer front together with the anionic components of the electrophoresis buffer, which also migrate through the gel. The area of the buffer front is made visible by adding the comparatively small, anionic dye bromophenol blue to the sample buffer. Due to the relatively small molecule size of bromophenol blue, it migrates faster than proteins. By optical control of the migrating colored band, the electrophoresis can be stopped before the dye and also the samples have completely migrated through the gel and leave it.
The most commonly used method is the discontinuous SDS-PAGE. In this method, the proteins migrate first into a collecting gel with neutral pH, in which they are concentrated and then they migrate into a separating gel with basic pH, in which the actual separation takes place. Stacking and separating gels differ by different pore size (4-6 % T and 10-20 % T), ionic strength and pH values (pH 6.8 or pH 8.8). The electrolyte most frequently used is an SDS-containing Tris-glycine-chloride buffer system. At neutral pH, glycine predominantly forms the zwitterionic form, at high pH the glycines lose positive charges and become predominantly anionic. In the collection gel, the smaller, negatively charged chloride ions migrate in front of the proteins (as leading ions) and the slightly larger, negatively and partially positively charged glycinate ions migrate behind the proteins (as initial trailing ions), whereas in the comparatively basic separating gel both ions migrate in front of the proteins. The pH gradient between the stacking and separation gel buffers leads to a stacking effect at the border of the stacking gel to the separation gel, since the glycinate partially loses its slowing positive charges as the pH increases and then, as the former trailing ion, overtakes the proteins and becomes a leading ion, which causes the bands of the different proteins (visible after a staining) to become narrower and sharper - the stacking effect. For the separation of smaller proteins and peptides, the TRIS-Tricine buffer system of Schägger and von Jagow is used due to the higher spread of the proteins in the range of 0.5 to 50 kDa.[20]
Gel staining edit

At the end of the electrophoretic separation, all proteins are sorted by size and can then be analyzed by other methods, e. g. protein staining such as Coomassie staining (most common and easy to use),[21][22] silver staining (highest sensitivity),[23][24][25][26][27][28] stains all staining, Amido black 10B staining,[22] Fast green FCF staining,[22] fluorescent stains such as epicocconone stain[29] and SYPRO orange stain,[30] and immunological detection such as the Western Blot.[31][32] The fluorescent dyes have a comparatively higher linearity between protein quantity and color intensity of about three orders of magnitude above the detection limit (the quantity of protein that can be estimated by color intensity). When using the fluorescent protein dye trichloroethanol, a subsequent protein staining is omitted if it was added to the gel solution and the gel was irradiated with UV light after electrophoresis.[33][34]
In Coomassie staining, gel is fixed in a 50% ethanol 10% glacial acetic acid solution for 1 hr. Then the solution is changed for fresh one and after 1 to 12 hrs gel is changed to a staining solution (50% methanol, 10% glacial acetic acid, 0.1% coomassie brilliant blue) followed by destaining changing several times a destaining solution of 40% methanol, 10% glacial acetic acid.
Analysis edit
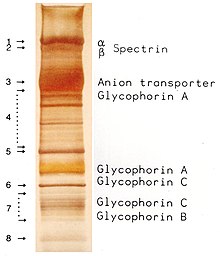
Protein staining in the gel creates a documentable banding pattern of the various proteins.
- Glycoproteins have differential levels of glycosylations and adsorb SDS more unevenly at the glycosylations, resulting in broader and blurred bands.[35]
- Membrane proteins, because of their transmembrane domain, are often composed of the more hydrophobic amino acids, have lower solubility in aqueous solutions, tend to bind lipids, and tend to precipitate in aqueous solutions due to hydrophobic effects when sufficient amounts of detergent are not present. This precipitation manifests itself for membrane proteins in a SDS-PAGE in "tailing" above the band of the transmembrane protein. In this case, more SDS can be used (by using more or more concentrated sample buffer) and the amount of protein in the sample application can be reduced.
- An overloading of the gel with a soluble protein creates a semicircular band of this protein (e. g. in the marker lane of the image at 66 kDa), allowing other proteins with similar molecular weights to be covered.
- A low contrast (as in the marker lane of the image) between bands within a lane indicates either the presence of many proteins (low purity) or, if using purified proteins and a low contrast occurs only below one band, it indicates a proteolytic degradation of the protein, which first causes degradation bands, and after further degradation produces a homogeneous color ("smear") below a band.[36]
The documentation of the banding pattern is usually done by photographing or scanning. For a subsequent recovery of the molecules in individual bands, a gel extraction can be performed.
Archiving edit

After protein staining and documentation of the banding pattern, the polyacrylamide gel can be dried for archival storage. Proteins can be extracted from it at a later date. The gel is either placed in a drying frame (with or without the use of heat) or in a vacuum dryer. The drying frame consists of two parts, one of which serves as a base for a wet cellophane film to which the gel and a one percent glycerol solution are added. Then a second wet cellophane film is applied bubble-free, the second frame part is put on top and the frame is sealed with clips. The removal of the air bubbles avoids a fragmentation of the gel during drying. The water evaporates through the cellophane film. In contrast to the drying frame, a vacuum dryer generates a vacuum and heats the gel to about 50 °C.
Molecular mass determination edit

For a more accurate determination of the molecular weight, the relative migration distances of the individual protein bands are measured in the separating gel.[37][38] The measurements are usually performed in triplicate for increased accuracy. The relative mobility (called Rf value or Rm value) is defined as the distance migrated by the protein band divided by the distance migrated by the buffer front. The distances are each measured from the beginning of the separation gel. The migration of the buffer front roughly corresponds to the migration of the dye contained in the sample buffer. The Rf's of the size marker are plotted semi-logarithmically against their known molecular weights. By comparison with the linear part of the generated graph or by a regression analysis, the molecular weight of an unknown protein can be determined by its relative mobility.[37][39]
Bands of proteins with glycosylations can be blurred,[35] as glycosylation is often heterogenous.[40] Proteins with many basic amino acids (e. g. histones)[41] can lead to an overestimation of the molecular weight or even not migrate into the gel at all, because they move slower in the electrophoresis due to the positive charges or even to the opposite direction. On the other hand, many acidic amino acids can lead to accelerated migration of a protein and an underestimation of its molecular mass.[42]
Applications edit
The SDS-PAGE in combination with a protein stain is widely used in biochemistry for the quick and exact separation and subsequent analysis of proteins. It has comparatively low instrument and reagent costs and is an easy-to-use method. Because of its low scalability, it is mostly used for analytical purposes and less for preparative purposes, especially when larger amounts of a protein are to be isolated.
Additionally, SDS-PAGE is used in combination with the western blot for the determination of the presence of a specific protein in a mixture of proteins - or for the analysis of post-translational modifications. Post-translational modifications of proteins can lead to a different relative mobility (i.e. a band shift) or to a change in the binding of a detection antibody used in the western blot (i.e. a band disappears or appears).
In mass spectrometry of proteins, SDS-PAGE is a widely used method for sample preparation prior to spectrometry, mostly using in-gel digestion. In regards to determining the molecular mass of a protein, the SDS-PAGE is a bit more exact than an analytical ultracentrifugation, but less exact than a mass spectrometry or - ignoring post-translational modifications - a calculation of the protein molecular mass from the DNA sequence.
In medical diagnostics, SDS-PAGE is used as part of the HIV test and to evaluate proteinuria. In the HIV test, HIV proteins are separated by SDS-PAGE and subsequently detected by Western Blot with HIV-specific antibodies of the patient, if they are present in his blood serum. SDS-PAGE for proteinuria evaluates the levels of various serum proteins in the urine, e.g. Albumin, Alpha-2-macroglobulin and IgG.
Variants edit
SDS-PAGE is the most widely used method for gel electrophoretic separation of proteins. Two-dimensional gel electrophoresis sequentially combines isoelectric focusing or BAC-PAGE with a SDS-PAGE. Native PAGE is used if native protein folding is to be maintained. For separation of membrane proteins, BAC-PAGE or CTAB-PAGE may be used as an alternative to SDS-PAGE. For electrophoretic separation of larger protein complexes, agarose gel electrophoresis can be used, e.g. the SDD-AGE. Some enzymes can be detected via their enzyme activity by zymography.
Alternatives edit
While being one of the more precise and low-cost protein separation and analysis methods, the SDS-PAGE denatures proteins. Where non-denaturing conditions are necessary, proteins are separated by a native PAGE or different chromatographic methods with subsequent photometric quantification, for example affinity chromatography (or even tandem affinity purification), size exclusion chromatography, ion exchange chromatography.[43] Proteins can also be separated by size in a tangential flow filtration[44] or an ultrafiltration.[45] Single proteins can be isolated from a mixture by affinity chromatography or by a pull-down assay. Some historically early and cost effective but crude separation methods usually based upon a series of extractions and precipitations using kosmotropic molecules, for example the ammonium sulfate precipitation and the polyethyleneglycol precipitation.
History edit
In 1948, Arne Tiselius was awarded the Nobel Prize in Chemistry for the discovery of the principle of electrophoresis as the migration of charged and dissolved atoms or molecules in an electric field.[46] The use of a solid matrix (initially paper discs) in a zone electrophoresis improved the separation. The discontinuous electrophoresis of 1964 by L. Ornstein and B. J. Davis made it possible to improve the separation by the stacking effect.[47] The use of cross-linked polyacrylamide hydrogels, in contrast to the previously used paper discs or starch gels, provided a higher stability of the gel and no microbial decomposition. The denaturing effect of SDS in continuous polyacrylamide gels and the consequent improvement in resolution was first described in 1965 by David F. Summers in the working group of James E. Darnell to separate poliovirus proteins.[48] The current variant of the SDS-PAGE was described in 1970 by Ulrich K. Laemmli and initially used to characterise the proteins in the head of bacteriophage T4.[1]
References edit
- ^ a b Laemmli, U. K. (1970). "Cleavage of Structural Proteins during the Assembly of the Head of Bacteriophage T4". Nature. 227 (5259): 680–685. Bibcode:1970Natur.227..680L. doi:10.1038/227680a0. ISSN 0028-0836. PMID 5432063. S2CID 3105149.
- ^ "Interview with Ulrich Lämmli". Neue Zürcher Zeitung (in German). No. 11. 2005. Retrieved March 4, 2012.
- ^ Neue Züricher Zeitung: Interview with Ulrich Lämmli (in German). NZZ Folio, No. 11, 2005. Accessed March 4, 2012.
- ^ Studier, F (2000-12-01). "Slab-gel electrophoresis". Trends in Biochemical Sciences. 25 (12). Elsevier BV: 588–590. doi:10.1016/s0968-0004(00)01679-0. ISSN 0968-0004. PMID 11116182.
- ^ a b c d Reynolds, JA; Tanford, Charles (1970). "Binding of dodecyl sulfate to proteins at high binding ratios. Possible implications for the state of proteins in biological membranes". Proc Natl Acad Sci U S A. 66 (3): 1002–7. Bibcode:1970PNAS...66.1002R. doi:10.1073/pnas.66.3.1002. PMC 283150. PMID 5269225.
- ^ Smith, B. J. (1984). "SDS Polyacrylamide Gel Electrophoresis of Proteins". Proteins. Methods in Molecular Biology. Vol. 1. pp. 41–56. doi:10.1385/0-89603-062-8:41. ISBN 0-89603-062-8. PMID 20512673.
- ^ Staikos, Georgios; Dondos, Anastasios (2009). "Study of the sodium dodecyl sulphate–protein complexes: evidence of their wormlike conformation by treating them as random coil polymers". Colloid and Polymer Science. 287 (8): 1001–1004. doi:10.1007/s00396-009-2059-3. ISSN 0303-402X. S2CID 97367384.
- ^ Turro, Nicholas J.; Yekta, Ahmad (1978). "Luminescent probes for detergent solutions. A simple procedure for determination of the mean aggregation number of micelles". Journal of the American Chemical Society. 100 (18): 5951–5952. doi:10.1021/ja00486a062. ISSN 0002-7863.
- ^ Berg, Jeremy M. (2015-04-08). Biochemistry. Tymoczko, John L.; Gatto, Gregory J. Jr.; Stryer, Lubert (Eighth ed.). New York. ISBN 9781464126109. OCLC 913469736.
{{cite book}}: CS1 maint: location missing publisher (link) - ^ Manning M, Colón W (2004). "Structural basis of protein kinetic stability: resistance to sodium dodecyl sulfate suggests a central role for rigidity and a bias toward beta-sheet structure". Biochemistry. 43 (35): 11248–54. doi:10.1021/bi0491898. PMID 15366934.
- ^ Buxbaum, Engelbert (2003). "Cationic electrophoresis and electrotransfer of membrane glycoproteins". Analytical Biochemistry. 314 (1): 70–76. doi:10.1016/S0003-2697(02)00639-5. ISSN 0003-2697. PMID 12633604.
- ^ Akin, Dianne T.; Shapira, Raymond; Kinkade, Joseph M. (1985). "The determination of molecular weights of biologically active proteins by cetyltrimethylammonium bromide-polyacrylamide gel electrophoresis". Analytical Biochemistry. 145 (1): 170–176. doi:10.1016/0003-2697(85)90343-4. ISSN 0003-2697. PMID 4003759.
- ^ Simpson, R. J. (2010). "CTAB-PAGE". Cold Spring Harbor Protocols. 2010 (4): pdb.prot5412. doi:10.1101/pdb.prot5412. ISSN 1559-6095. PMID 20360366.
- ^ Hartinger, Joachim; Stenius, Katinka; Högemann, Dagmar; Jahn, Reinhard (1996). "16-BAC/SDS–PAGE: A Two-Dimensional Gel Electrophoresis System Suitable for the Separation of Integral Membrane Proteins". Analytical Biochemistry. 240 (1): 126–133. doi:10.1006/abio.1996.0339. ISSN 0003-2697. PMID 8811889.
- ^ Margolis J, Kenrick KG (1969). "2-dimensional resolution of plasma proteins by combination of polyacrylamide disc and gradient gel electrophoresis". Nature. 221 (5185): 1056–7. Bibcode:1969Natur.221.1056M. doi:10.1038/2211056a0. PMID 5774398. S2CID 4197850.
- ^ a b c Hachmann, John P.; Amshey, Joseph W. (2005). "Models of protein modification in Tris–glycine and neutral pH Bis–Tris gels during electrophoresis: Effect of gel pH". Analytical Biochemistry. 342 (2): 237–245. doi:10.1016/j.ab.2005.04.015. ISSN 0003-2697. PMID 15935323.
- ^ Wiltfang, Jens; Arold, Norbert; Neuhoff, Volker (1991). "A new multiphasic buffer system for sodium dodecyl sulfate-polyacrylamide gel electrophoresis of proteins and peptides with molecular masses 100 000-1000, and their detection with picomolar sensitivity". Electrophoresis. 12 (5): 352–366. doi:10.1002/elps.1150120507. ISSN 0173-0835. PMID 1718736. S2CID 40101706.
- ^ Moebius, Jan; Denker, Katrin; Sickmann, Albert (2007). "Ruthenium (II) tris-bathophenanthroline disulfonate is well suitable for Tris-Glycine PAGE but not for Bis-Tris gels". Proteomics. 7 (4): 524–527. doi:10.1002/pmic.200600642. ISSN 1615-9853. PMID 17309097. S2CID 25822873.
- ^ Rosenberg, Ian M. (22 December 2006). Protein Analysis and Purification: Benchtop Techniques. Springer Science & Business Media. pp. 103–. ISBN 978-0-8176-4412-3.
- ^ Schägger, Hermann; von Jagow, Gebhard (1987). "Tricine-sodium dodecyl sulfate-polyacrylamide gel electrophoresis for the separation of proteins in the range from 1 to 100 kDa". Analytical Biochemistry. 166 (2): 368–379. doi:10.1016/0003-2697(87)90587-2. ISSN 0003-2697. PMID 2449095.
- ^ Fazekas de St. Groth, S.; Webster, R. G.; Datyner, A. (1963). "Two new staining procedures for quantitative estimation of proteins on electrophoretic strips". Biochimica et Biophysica Acta. 71: 377–391. doi:10.1016/0006-3002(63)91092-8. PMID 18421828.
- ^ a b c Wilson, CM (1979). "Studies and critique of Amido Black 10B, Coomassie Blue R, and Fast Green FCF as stains for proteins after polyacrylamide gel electrophoresis". Anal Biochem. 96 (2): 263–78. doi:10.1016/0003-2697(79)90581-5. PMID 89822.
- ^ Merril, C. R.; Switzer, R. C.; Keuren, M. L. Van (1979). "Trace polypeptides in cellular extracts and human body fluids detected by two-dimensional electrophoresis and a highly sensitive silver stain". Proc Natl Acad Sci U S A. 76 (9): 4335–4339. Bibcode:1979PNAS...76.4335M. doi:10.1073/pnas.76.9.4335. PMC 411569. PMID 92027.
- ^ R. C. Switzer, C. R. Merril, S. Shifrin (September 1979), "A highly sensitive silver stain for detecting proteins and peptides in polyacrylamide gels", Anal Biochem (in German), vol. 98, no. 1, pp. 231–237, doi:10.1016/0003-2697(79)90732-2, PMID 94518
{{citation}}: CS1 maint: multiple names: authors list (link) - ^ Blum, H.; Beier, H.; Gross, H. J. (1987). "Improved silver staining of plant protein, RNA & DNA in PAA gels". Electrophoresis. 8: 93–99. doi:10.1002/elps.1150080203. S2CID 84471792.
- ^ Rabilloud, T.; et al. (1988). "Improvement and simplification of low-background silver staining of proteins by using sodium dithionite". Electrophoresis. 9 (6): 288–291. doi:10.1002/elps.1150090608. PMID 2466660. S2CID 33007991.
- ^ Rabilloud, T. (1992). "A comparison between low background silver diammine and silver nitrate protein stains". Electrophoresis. 13 (7): 429–439. doi:10.1002/elps.1150130190. PMID 1425556. S2CID 43084621.
- ^ Lelong, C.; Chevallet, M.; Luche, S.; Rabilloud, T. (2009). "Silver Staining of Proteins in 2DE Gels". Two-Dimensional Electrophoresis Protocols (PDF). Methods Mol Biol. Vol. 519. pp. 339–350. doi:10.1007/978-1-59745-281-6_21. ISBN 978-1-58829-937-6. PMID 19381593. S2CID 52820065.
- ^ Moritz, Christian P.; Marz, Sabrina X.; Reiss, Ralph; Schulenborg, Thomas; Friauf, Eckhard (February 2014). "Epicocconone staining: a powerful loading control for Western blots". Proteomics. 14 (2–3): 162–8. doi:10.1002/pmic.201300089. PMID 24339236. S2CID 206368546.
- ^ Demchenko, Aleksandr Petrovich (2011). Advanced Fluorescence Reporters in Chemistry and Biology III: Applications in Sensing and Imaging Band 3 von Advanced Fluorescence Reporters in Chemistry and Biology. Springer. ISBN 978-3-642-18035-4.
- ^ Gallagher, Sean; Chakavarti, Deb (2008). "Staining Proteins in Gels". Journal of Visualized Experiments (17). doi:10.3791/760. ISSN 1940-087X. PMC 3253607. PMID 19066521.
- ^ Wilson, CM (1983). "Staining of proteins on gels: Comparisons of dyes and procedures". Enzyme Structure Part I. Methods Enzymol. Vol. 91. pp. 236–47. doi:10.1016/s0076-6879(83)91020-0. ISBN 9780121819910. PMID 6190068.
- ^ Ladner CL, Yang J, Turner RJ, Edwards RA (2004). "Visible fluorescent detection of proteins in polyacrylamide gels without staining". Anal Biochem. 326 (1): 13–20. doi:10.1016/j.ab.2003.10.047. PMID 14769330.
- ^ Gilda JE, Gomes AV (2013). "Stain-Free total protein staining is a superior loading control to β-actin for Western blots". Anal Biochem. 440 (2): 186–8. doi:10.1016/j.ab.2013.05.027. PMC 3809032. PMID 23747530.
- ^ a b Cryo-EM Part A: Sample Preparation and Data Collection. Academic Press. 30 September 2010. p. 28. ISBN 978-0-08-095695-4.
- ^ Burgess, Richard R.; Deutscher, Murray P. (3 November 2009). Guide to Protein Purification. Academic Press. pp. 184–. ISBN 978-0-08-092317-8.
- ^ a b Bonner, Philip L. R.; Hargreaves, Alan J. (24 August 2011). Basic Bioscience Laboratory Techniques: A Pocket Guide. John Wiley & Sons. pp. 140–. ISBN 978-1-119-95644-0.
- ^ Holtzhauer, Martin (13 September 2006). Basic Methods for the Biochemical Lab. Springer Science & Business Media. pp. 243–. ISBN 978-3-540-32786-8.
- ^ Caprette, David R (January 5, 2007). "Measuring mobility of protein bands". www.ruf.rice.edu.
- ^ "Beginners Guide To Glycosylation Of Proteins". Peak Proteins. 25 February 2021.
- ^ van Venrooij, W. J.; Maini, Ravinder N. (6 December 2012). Manual of Biological Markers of Disease. Springer Science & Business Media. pp. 50–. ISBN 978-94-011-1670-1.
- ^ Guan, Yihong; Zhu, Qinfang; Huang, Delai; et al. (2015). "An equation to estimate the difference between theoretically predicted and SDS PAGE-displayed molecular weights for an acidic peptide". Scientific Reports. 5 (1): 13370. Bibcode:2015NatSR...513370G. doi:10.1038/srep13370. ISSN 2045-2322. PMC 4550835. PMID 26311515.
- ^ Janson, Jan-Christer (3 January 2012). Protein Purification: Principles, High Resolution Methods, and Applications. John Wiley & Sons. ISBN 978-1-118-00219-3.
- ^ Desai, Mohamed A. (2000). Downstream Processing of Proteins: Methods and Protocols. Springer Science & Business Media. p. 35. ISBN 978-1-59259-027-8.
- ^ Raja, Ghosh (11 June 2003). Protein Bioseparation Using Ultrafiltration: Theory, Applications And New Developments. World Scientific. p. 142. ISBN 978-1-78326-126-0.
- ^ Pederson, T. (2007). "Turning a PAGE: the overnight sensation of SDS-polycrylamide gel electrophoresis". The FASEB Journal. 22 (4): 949–953. doi:10.1096/fj.08-0402ufm. ISSN 0892-6638. PMID 18378803. S2CID 33466516.
- ^ Ornstein, L.; Davis, B. J. (1964). "Disc Electrophoresis –1. Background and Theory". Ann NY Acad Sci. 121 (2): 321–349. Bibcode:1964NYASA.121..321O. doi:10.1111/j.1749-6632.1964.tb14207.x. PMID 14240533. S2CID 28591995.
- ^ Summers DF, Maizel JV, Darnell JE (1965). "Evidence for virus-specific noncapsid proteins in poliovirus-infected HeLa cells". Proc Natl Acad Sci U S A. 54 (2): 505–13. Bibcode:1965PNAS...54..505S. doi:10.1073/pnas.54.2.505. PMC 219696. PMID 4285933.
External links edit
- Protocol for BisTris SDS-PAGE at OpenWetWare.org