


Summary
Salmsach is a municipality in the district of Arbon in the canton of Thurgau in Switzerland.
Salmsach | |
|---|---|
 Coat of arms | |
Location of Salmsach .mw-parser-output .locmap .od{position:absolute}.mw-parser-output .locmap .id{position:absolute;line-height:0}.mw-parser-output .locmap .l0{font-size:0;position:absolute}.mw-parser-output .locmap .pv{line-height:110%;position:absolute;text-align:center}.mw-parser-output .locmap .pl{line-height:110%;position:absolute;top:-0.75em;text-align:right}.mw-parser-output .locmap .pr{line-height:110%;position:absolute;top:-0.75em;text-align:left}.mw-parser-output .locmap .pv>div{display:inline;padding:1px}.mw-parser-output .locmap .pl>div{display:inline;padding:1px;float:right}.mw-parser-output .locmap .pr>div{display:inline;padding:1px;float:left}html.skin-theme-clientpref-night .mw-parser-output .od,html.skin-theme-clientpref-night .mw-parser-output .od .pv>div,html.skin-theme-clientpref-night .mw-parser-output .od .pl>div,html.skin-theme-clientpref-night .mw-parser-output .od .pr>div{background:#000;color:#fff}html.skin-theme-clientpref-night .mw-parser-output .locmap{filter:grayscale(0.6)}@media(prefers-color-scheme:dark){html.skin-theme-clientpref-os .mw-parser-output .locmap{filter:grayscale(0.6)}html.skin-theme-clientpref-os .mw-parser-output .od,html.skin-theme-clientpref-os .mw-parser-output .od .pv>div,html.skin-theme-clientpref-os .mw-parser-output .od .pl>div,html.skin-theme-clientpref-os .mw-parser-output .od .pr>div{background:#000;color:#fff}}  Salmsach 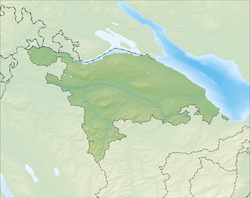 Salmsach | |
| Coordinates: 47°33′N 9°22′E / 47.550°N 9.367°E | |
| Country | Switzerland |
| Canton | Thurgau |
| District | Arbon |
| Area | |
| • Total | 2.6 km2 (1.0 sq mi) |
| Elevation | 400 m (1,300 ft) |
| Population (31 December 2018)[2] | |
| • Total | 1,457 |
| • Density | 560/km2 (1,500/sq mi) |
| Time zone | UTC+01:00 (Central European Time) |
| • Summer (DST) | UTC+02:00 (Central European Summer Time) |
| Postal code(s) | 8599 |
| SFOS number | 4441 |
| ISO 3166 code | CH-TG |
| Surrounded by | Amriswil, Egnach, Friedrichshafen (DE-BY), Hefenhofen, Romanshorn |
| Website | www SFSO statistics |
History edit
Salmsach is first mentioned in 1155 as Salmasa.[3] Salmsach was probably founded by the Bishop of Constance Salomo I who founded a religious community there. It was placed under the Abbey of St. Stephen in Constance by Salomo III in 910. In 1155 the abbey owned a farm, five Schupposen, some tithe rights and half the church treasure in Salmsach. In 1380 it acquired at least the low justice rights as well. The Abbot of St. Gall, Ulrich Rösch, acquired Salmsach and the church treasure in 1471 and united it with the court of Romanshorn. They remained united until 1798. (to 1798). The Knights of the Churchyard of Arbon, who had entered into a contract in 1201 with provost and the Abbey of St. Stephen, were allowed to appoint the pastor and had other rights in the village. During the Protestant Reformation, Salmsach converted to the new religion. After 1588, the pastor of Salmsach also held services in Romanshorn. In 1917, Salmsach merged with the parish of Romanshorn.[3]
In 1742 a school was founded in both Salmsach and Hungerbüel. The village of Hungerbüel merged with Salmsach in 1812.
The main economic activity in the village included fruit production, horticulture and agriculture, though in the 19th Century two mills opened. A factory opened in 1860 in Amelung to manufacture starch. Between 1878-92 an embroidery factory operated and between 1889-1931 a steam sawmill was running. In 1987, a plastic factory opened. While it has retained the character of a little country hamlet, it is a residential community for the nearby town of Romanshorn. In 2005, the agriculture accounts for about 29% of jobs in the community.[3]
Geography edit
Salmsach has an area, as of 2009[update], of 2.7 square kilometers (1.0 sq mi). Of this area, 1.85 km2 (0.71 sq mi) or 68.5% is used for agricultural purposes, while 0.22 km2 (0.085 sq mi) or 8.1% is forested. Of the rest of the land, 0.54 km2 (0.21 sq mi) or 20.0% is settled (buildings or roads), 0.01 km2 (2.5 acres) or 0.4% is either rivers or lakes and 0.01 km2 (2.5 acres) or 0.4% is unproductive land.[4]
Of the built up area, industrial buildings made up 12.2% of the total area while housing and buildings made up 3.7% and transportation infrastructure made up 0.4%. while parks, green belts and sports fields made up 3.3%. Out of the forested land, 5.9% of the total land area is heavily forested and 2.2% is covered with orchards or small clusters of trees. Of the agricultural land, 50.7% is used for growing crops, while 17.8% is used for orchards or vine crops. All the water in the municipality is flowing water.[4]
The municipality is located in the Arbon district, south of Romanshorn. It consists of the village of Salmsach and the hamlets of Buerüüti, Fälwis and Hungerbüel.
Demographics edit
Salmsach has a population (as of December 2020[update]) of 1,481.[5] As of 2008[update], 22.1% of the population are foreign nationals.[6] Over the last 10 years (1997–2007) the population has changed at a rate of 1.6%. Most of the population (as of 2000[update]) speaks German (86.2%), with Turkish being second most common ( 3.2%) and Albanian being third ( 3.1%).[7]
As of 2008[update], the gender distribution of the population was 48.9% male and 51.1% female. The population was made up of 486 Swiss men (38.0% of the population), and 140 (10.9%) non-Swiss men. There were 511 Swiss women (39.9%), and 143 (11.2%) non-Swiss women.[6]
In 2008[update] there were 10 live births to Swiss citizens and 5 births to non-Swiss citizens, and in same time span there were 11 deaths of Swiss citizens. Ignoring immigration and emigration, the population of Swiss citizens decreased by 1 while the foreign population increased by 5. There were 2 non-Swiss men who emigrated from Switzerland to another country and 1 non-Swiss woman who emigrated from Switzerland to another country. The total Swiss population change in 2008 (from all sources) was a decrease of 17 and the non-Swiss population change was an increase of 1 people. This represents a population growth rate of -1.2%.[6]
The age distribution, as of 2009[update], in Salmsach is; 117 children or 9.0% of the population are between 0 and 9 years old and 163 teenagers or 12.6% are between 10 and 19. Of the adult population, 185 people or 14.3% of the population are between 20 and 29 years old. 162 people or 12.5% are between 30 and 39, 223 people or 17.2% are between 40 and 49, and 196 people or 15.1% are between 50 and 59. The senior population distribution is 134 people or 10.3% of the population are between 60 and 69 years old, 78 people or 6.0% are between 70 and 79, there are 33 people or 2.5% who are between 80 and 89, and there are 5 people or 0.4% who are 90 and older.[8]
As of 2000[update], there were 507 private households in the municipality, and an average of 2.6 persons per household.[7] In 2000[update] there were 187 single family homes (or 72.8% of the total) out of a total of 257 inhabited buildings. There were 26 two family buildings (10.1%), 20 three family buildings (7.8%) and 24 multi-family buildings (or 9.3%).[9] There were 299 (or 22.5%) persons who were part of a couple without children, and 744 (or 56.1%) who were part of a couple with children. There were 94 (or 7.1%) people who lived in single parent home, while there are 13 persons who were adult children living with one or both parents, 2 persons who lived in a household made up of relatives, 12 who lived in a household made up of unrelated persons, and 30 who are either institutionalized or live in another type of collective housing.[10]
The vacancy rate for the municipality, in 2008[update], was 2.06%. As of 2007[update], the construction rate of new housing units was 3.9 new units per 1000 residents.[7] In 2000[update] there were 566 apartments in the municipality. The most common apartment size was the 4 room apartment of which there were 164. There were 15 single room apartments and 83 apartments with six or more rooms.[11] As of 2000[update] the average price to rent an average apartment in Salmsach was 966.66 Swiss francs (CHF) per month (US$770, £430, €620 approx. exchange rate from 2000). The average rate for a one-room apartment was 700.00 CHF (US$560, £320, €450), a two-room apartment was about 763.33 CHF (US$610, £340, €490), a three-room apartment was about 815.70 CHF (US$650, £370, €520) and a six or more room apartment cost an average of 1365.75 CHF (US$1090, £610, €870). The average apartment price in Salmsach was 86.6% of the national average of 1116 CHF.[12]
In the 2007 federal election the most popular party was the SVP which received 40.85% of the vote. The next three most popular parties were the SP (16.16%), the CVP (12.51%) and the Green Party (11.76%). In the federal election, a total of 314 votes were cast, and the voter turnout was 38.4%.[13]
The historical population is given in the following table:[3][14]
| year | population |
|---|---|
| 1850 | 419 |
| 1900 | 719 |
| 1950 | 812 |
| 1980 | 1,159 |
| 1990 | 1,314 |
| 2000 | 1,326 |
Economy edit
As of 2007[update], Salmsach had an unemployment rate of 2.19%. As of 2005[update], there were 72 people employed in the primary economic sector and about 19 businesses involved in this sector. 67 people are employed in the secondary sector and there are 12 businesses in this sector. 108 people are employed in the tertiary sector, with 24 businesses in this sector.[7]
In 2000[update] there were 912 workers who lived in the municipality. Of these, 561 or about 61.5% of the residents worked outside Salmsach while 125 people commuted into the municipality for work. There were a total of 476 jobs (of at least 6 hours per week) in the municipality.[15] Of the working population, 10.7% used public transportation to get to work, and 47.7% used a private car.[7]
Religion edit
From the 2000 census[update], 439 or 33.1% were Roman Catholic, while 532 or 40.1% belonged to the Swiss Reformed Church. Of the rest of the population, there was 1 Old Catholic who belonged to the Christian Catholic Church of Switzerland there are 16 individuals (or about 1.21% of the population) who belong to the Orthodox Church, and there are 35 individuals (or about 2.64% of the population) who belong to another Christian church. There were 132 (or about 9.95% of the population) who are Islamic. There are 16 individuals (or about 1.21% of the population) who belong to another church (not listed on the census), 100 (or about 7.54% of the population) belong to no church, are agnostic or atheist, and 55 individuals (or about 4.15% of the population) did not answer the question.[16]
Education edit
In Salmsach about 64.1% of the population (between age 25-64) have completed either non-mandatory upper secondary education or additional higher education (either university or a Fachhochschule).[7]
Salmsach is home to the Salmsach combined municipal and primary school district. In the 2008/2009 school year there are 106 students. There are 29 children in the kindergarten, and the average class size is 14.5 kindergartners. Of the children in kindergarten, 14 or 48.3% are female, 8 or 27.6% are not Swiss citizens and 7 or 24.1% do not speak German natively. The lower and upper primary levels begin at about age 5-6 and lasts for 6 years. There are 31 children in who are at the lower primary level and 46 children in the upper primary level. The average class size in the primary school is 19.25 students. At the lower primary level, there are 20 children or 64.5% of the total population who are female, 6 or 19.4% are not Swiss citizens and 5 or 16.1% do not speak German natively. In the upper primary level, there are 26 or 56.5% who are female, 13 or 28.3% are not Swiss citizens and 12 or 26.1% do not speak German natively.[17]
References edit
- ^ a b "Arealstatistik Standard - Gemeinden nach 4 Hauptbereichen". Federal Statistical Office. Retrieved 13 January 2019.
- ^ "Ständige Wohnbevölkerung nach Staatsangehörigkeitskategorie Geschlecht und Gemeinde; Provisorische Jahresergebnisse; 2018". Federal Statistical Office. 9 April 2019. Retrieved 11 April 2019.
- ^ a b c d Salmsach in German, French and Italian in the online Historical Dictionary of Switzerland.
- ^ a b Swiss Federal Statistical Office-Land Use Statistics 2009 data (in German) accessed 25 March 2010
- ^ "Ständige und nichtständige Wohnbevölkerung nach institutionellen Gliederungen, Geburtsort und Staatsangehörigkeit". bfs.admin.ch (in German). Swiss Federal Statistical Office - STAT-TAB. 31 December 2020. Retrieved 21 September 2021.
- ^ a b c Swiss Federal Statistical Office - Superweb database - Gemeinde Statistics 1981-2008 (in German) accessed 19 June 2010
- ^ a b c d e f Swiss Federal Statistical Office accessed 08-September-2010
- ^ Statistical Office of Thurgau Archived 2010-02-05 at the Wayback Machine, MS Excel document – Altersstruktur der Wohnbevölkerung nach zivilrechtlichem Wohnsitzbegriff am 31.12.2009 (in German) accessed 23 June 2010
- ^ Statistical Office of Thurgau Archived 2010-04-20 at the Wayback Machine, MS Excel document - Wohngebäude nach Anzahl Wohneinheiten und Gemeinden, Jahr 2000 (in German) accessed 24 June 2010
- ^ Statistical Office of Thurgau Archived 2009-12-30 at the Wayback Machine, MS Excel document – Wohnbevölkerung nach Haushaltstyp und Gemeinde, Jahr 2000 (in German) accessed 23 June 2010
- ^ Statistical Office of Thurgau Archived 2010-04-20 at the Wayback Machine, MS Excel document - Wohnungen nach Anzahl Zimmer und Gemeinden, Jahr 2000 (in German) accessed 24 June 2010
- ^ Statistical Office of Thurgau Archived 2010-05-07 at the Wayback Machine, MS Excel document - Durchschnittlicher Wohnungsmietpreis nach Anzahl Zimmer und Gemeinden (in German) accessed 24 June 2010
- ^ Swiss Federal Statistical Office, Nationalratswahlen 2007: Stärke der Parteien und Wahlbeteiligung, nach Gemeinden/Bezirk/Canton (in German) accessed 28 May 2010
- ^ Statistical Office of Thurgau Archived 2010-04-14 at the Wayback Machine, MS Excel document – Wohnbevölkerung im Kanton Thurgau nach Gemeinden, seit 1850 (in German) accessed 22 June 2010
- ^ Swiss Federal Statistical Office - Statweb Archived 2012-08-04 at archive.today (in German) accessed 24 June 2010
- ^ Statistical Office of Thurgau Archived 2010-04-18 at the Wayback Machine, MS Excel document – Wohnbevölkerung Gemeinden nach religiöser Zugehörigkeit, Jahr 2000 (in German) accessed 23 June 2010
- ^ Canton Thurgau Schools (in German) accessed 23 June 2010