
KNOWPIA
WELCOME TO KNOWPIA

Sandwell Metropolitan Borough Council elections 
Summary
Sandwell Borough Council elections are held three years out of every four, with a third of the council elected each time. Sandwell Metropolitan Borough Council is the local authority for the metropolitan borough of Sandwell in the West Midlands, England. Since the last boundary changes in 2004, 72 councillors have been elected from 24 wards.[1]
Political control edit
The first elections to the council were held in 1973, initially operating as a shadow authority until coming into its powers on 1 April 1974. Political control of the council since 1974 has been held by the following parties:[2][3]
| Party in control | Years | |
|---|---|---|
| Labour | 1974–1978 | |
| Conservative | 1978–1979 | |
| Labour | 1979–present | |
Leadership edit
The leaders of the council since 1997 have been:[4]
| Councillor | Party | From | To | |
|---|---|---|---|---|
| Tarsem King[5] | Labour | 1997 | 2001 | |
| Bill Thomas[6][7] | Labour | 2001 | 23 Oct 2009 | |
| Darren Cooper[8] | Labour | 1 Dec 2009 | 26 Mar 2016 | |
| Steve Eling[9] | Labour | 24 May 2016 | 13 Feb 2019 | |
| Steve Trow[10] | Labour | 5 Mar 2019 | 3 May 2019 | |
| Yvonne Davies | Labour | 21 May 2019 | 8 Jul 2020 | |
| Rajbir Singh[11] | Labour | 25 May 2021 | 16 Nov 2021 | |
| Kerrie Carmichael | Labour | 7 Dec 2021 | ||
Council elections edit
- 1998 Sandwell Metropolitan Borough Council election
- 1999 Sandwell Metropolitan Borough Council election
- 2000 Sandwell Metropolitan Borough Council election
- 2002 Sandwell Metropolitan Borough Council election
- 2003 Sandwell Metropolitan Borough Council election
- 2004 Sandwell Metropolitan Borough Council election (whole council elected after boundary changes)[12][1]
- 2006 Sandwell Metropolitan Borough Council election
- 2007 Sandwell Metropolitan Borough Council election
- 2008 Sandwell Metropolitan Borough Council election
- 2010 Sandwell Metropolitan Borough Council election
- 2011 Sandwell Metropolitan Borough Council election
- 2012 Sandwell Metropolitan Borough Council election
- 2014 Sandwell Metropolitan Borough Council election
- 2015 Sandwell Metropolitan Borough Council election
- 2016 Sandwell Metropolitan Borough Council election
- 2018 Sandwell Metropolitan Borough Council election
- 2019 Sandwell Metropolitan Borough Council election
- 2021 Sandwell Metropolitan Borough Council election
- 2022 Sandwell Metropolitan Borough Council election
- 2023 Sandwell Metropolitan Borough Council election
- 2024 Sandwell Metropolitan Borough Council election
Borough result maps edit
-
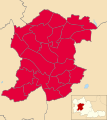
 2004 results map
 -
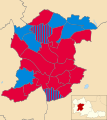
 2006 results map
 -
 2007 results map
 -
 2008 results map
 -
 2010 results map
 -
 2011 results map
 -
 2012 results map
 -
 2014 results map
 -
 2015 results map
 -
 2016 results map
 -
 2018 results map
 -
 2019 results map
 -
 2021 results map
 -
 2022 results map
 -
 2023 results map


By-election results edit
1994-1998 edit
| Party | Candidate | Votes | % | ±% | |
|---|---|---|---|---|---|
| Labour | 481 | 48.1 | -21.4 | ||
| Liberal Democrats | 288 | 28.8 | +15.6 | ||
| Conservative | 144 | 14.4 | -2.9 | ||
| National Democrats | 70 | 7.0 | +7.0 | ||
| Socialist Alternative | 16 | 1.6 | +1.6 | ||
| Majority | 193 | 19.3 | |||
| Turnout | 999 | 10.2 | |||
| Labour hold | Swing | ||||
| Party | Candidate | Votes | % | ±% | |
|---|---|---|---|---|---|
| Labour | 1,053 | 71.0 | -6.2 | ||
| Liberal Democrats | 283 | 19.1 | +19.1 | ||
| Conservative | 148 | 10.0 | -12.8 | ||
| Majority | 770 | 51.9 | |||
| Turnout | 1,484 | 15.6 | |||
| Labour hold | Swing | ||||
1998-2002 edit
| Party | Candidate | Votes | % | ±% | |
|---|---|---|---|---|---|
| Labour | Barbara Price | 831 | 57.3 | +0.3 | |
| Independent | Fred Hadley | 423 | 29.2 | -13.8 | |
| Conservative | Fredric Powles | 104 | 7.2 | +7.2 | |
| Liberal Democrats | Julai Garrett | 91 | 6.3 | +6.3 | |
| Majority | 408 | 28.1 | |||
| Turnout | 1,449 | ||||
| Labour hold | Swing | ||||
| Party | Candidate | Votes | % | ±% | |
|---|---|---|---|---|---|
| Labour | Joyce Edis | 558 | 44.4 | -9.8 | |
| Liberal Democrats | Rachel Cheeseman | 483 | 38.5 | +8.1 | |
| Conservative | Raymond Nock | 215 | 17.1 | +1.8 | |
| Majority | 75 | 5.9 | |||
| Turnout | 1,256 | 13.6 | |||
| Labour hold | Swing | ||||
| Party | Candidate | Votes | % | ±% | |
|---|---|---|---|---|---|
| Labour | Malcolm Bridges | 781 | 56.8 | -4.8 | |
| Conservative | Nicholas Meacham | 452 | 32.8 | +4.2 | |
| Liberal Democrats | Mark Handy | 143 | 10.4 | +0.6 | |
| Majority | 329 | 24.0 | |||
| Turnout | 1,376 | 14.3 | |||
| Labour hold | Swing | ||||
| Party | Candidate | Votes | % | ±% | |
|---|---|---|---|---|---|
| Liberal Democrats | Rachael Cheeseman | 573 | 48.6 | +18.2 | |
| Labour | Michael Davies | 466 | 39.5 | -14.7 | |
| Conservative | Raymond Nock | 141 | 11.9 | -3.4 | |
| Majority | 107 | 9.1 | |||
| Turnout | 1,180 | 12.7 | |||
| Liberal Democrats gain from Labour | Swing | ||||
| Party | Candidate | Votes | % | ±% | |
|---|---|---|---|---|---|
| Independent | Kazi Rahman | 907 | 50.6 | +18.0 | |
| Labour | Jasbir Gill | 731 | 40.8 | -11.1 | |
| Conservative | Ewart Johnson | 113 | 6.3 | -5.1 | |
| Liberal Democrats | Roger Prior | 39 | 2.2 | -1.9 | |
| Majority | 176 | 9.8 | |||
| Turnout | 1,790 | 21.9 | |||
| Independent gain from Labour | Swing | ||||
| Party | Candidate | Votes | % | ±% | |
|---|---|---|---|---|---|
| Labour | Iris Boucher | 3,142 | 63.1 | +7.4 | |
| Conservative | David Gill | 1,313 | 26.4 | -1.9 | |
| Liberal Democrats | Walter Bowdler | 528 | 10.6 | +10.6 | |
| Majority | 1,829 | 36.7 | |||
| Turnout | 4,984 | ||||
| Labour hold | Swing | ||||
| Party | Candidate | Votes | % | ±% | |
|---|---|---|---|---|---|
| Conservative | Frank Betteridge | 1,083 | 55.7 | -6.5 | |
| Labour | Elaine Gailes | 775 | 39.8 | +2.0 | |
| Liberal Democrats | Lynne Yardley | 88 | 4.5 | +4.5 | |
| Majority | 308 | 15.9 | |||
| Turnout | 1,946 | 20.8 | |||
| Conservative hold | Swing | ||||
2002-2006 edit
| Party | Candidate | Votes | % | ±% | |
|---|---|---|---|---|---|
| Labour | Victor Silvester | 1,334 | 66.1 | -11.0 | |
| Conservative | Amrick Uppal | 475 | 23.5 | +0.6 | |
| Socialist Labour | Boota singh | 210 | 10.4 | +10.4 | |
| Majority | 859 | 42.6 | |||
| Turnout | 2,019 | 23.8 | |||
| Labour hold | Swing | ||||
| Party | Candidate | Votes | % | ±% | |
|---|---|---|---|---|---|
| Labour | Trevor Crumpton | 1,087 | 42.3 | -1.8 | |
| Conservative | Leslie Pawlowski | 778 | 30.3 | -25.6 | |
| BNP | Simon Smith | 410 | 15.9 | +15.9 | |
| Liberal Democrats | Christopher Reed | 293 | 11.4 | +11.4 | |
| Majority | 309 | 12.0 | |||
| Turnout | 2,568 | 29.2 | |||
| Labour gain from Conservative | Swing | ||||
2006-2010 edit
| Party | Candidate | Votes | % | ±% | |
|---|---|---|---|---|---|
| Conservative | Raymond Nock | 870 | 34.5 | -3.0 | |
| Labour | Ralph Perkins | 801 | 31.7 | +6.8 | |
| BNP | Arthur Copson | 544 | 21.6 | +1.3 | |
| Liberal Democrats | Martin Roebuck | 238 | 9.4 | -7.9 | |
| Green | Victoria Dunn | 71 | 2.8 | +2.8 | |
| Majority | 69 | 2.8 | |||
| Turnout | 2,524 | 27.4 | |||
| Conservative hold | Swing | ||||
| Party | Candidate | Votes | % | ±% | |
|---|---|---|---|---|---|
| Labour | Delia Edwards | 796 | 48.1 | +12.4 | |
| Conservative | Beatrice Owen | 517 | 31.2 | +11.4 | |
| BNP | Karen Parkes | 314 | 19.0 | -15.9 | |
| Liberal Democrats | Dorothy Brayshaw | 29 | 1.8 | +1.8 | |
| Majority | 279 | 16.9 | |||
| Turnout | 1,656 | 18.6 | |||
| Labour gain from BNP | Swing | ||||
| Party | Candidate | Votes | % | ±% | |
|---|---|---|---|---|---|
| Labour | David Hosell | 844 | 36.9 | +2.6 | |
| Liberal Democrats | Michaela Allcock | 809 | 35.4 | -6.9 | |
| Conservative | Valerie Ward | 587 | 25.7 | +2.3 | |
| Green | David Hawkins | 45 | 2.0 | +2.0 | |
| Majority | 35 | 1.5 | |||
| Turnout | 2,285 | 25.9 | |||
| Labour gain from Liberal Democrats | Swing | ||||
| Party | Candidate | Votes | % | ±% | |
|---|---|---|---|---|---|
| Labour | Olwen Jones | 1,006 | 45.1 | +6.7 | |
| Conservative | Mike Warner | 946 | 42.4 | +1.6 | |
| Liberal Democrats | Dorothy Brayshaw | 168 | 7.5 | +7.5 | |
| Green | Colin Bye | 109 | 4.9 | -0.2 | |
| Majority | 60 | 2.7 | |||
| Turnout | 2,229 | 23.5 | |||
| Labour hold | Swing | ||||
2010-2014 edit
| Party | Candidate | Votes | % | ±% | |
|---|---|---|---|---|---|
| Labour | Peter Hughes | 1,322 | 62.1 | +23.9 | |
| Conservative | Mike Warner | 643 | 30.2 | -9.0 | |
| National Front | Ade Woodhouse | 76 | 3.6 | +3.6 | |
| Liberal Democrats | Mary Wilson | 45 | 2.1 | -8.4 | |
| Green | Colin Bye | 42 | 2.9 | +2.0 | |
| Majority | 679 | 31.9 | |||
| Turnout | 2,128 | 21.4 | |||
| Labour gain from Conservative | Swing | ||||
2014-2018 edit
| Party | Candidate | Votes | % | ±% | |
|---|---|---|---|---|---|
| Labour | Keith Allcock | 1,152 | 59.1 | +11.1 | |
| Conservative | Tony Ward | 452 | 23.2 | -5.6 | |
| UKIP | Steve Latham | 310 | 15.9 | -7.3 | |
| Green | Murray Abbott | 36 | 1.8 | +1.8 | |
| Majority | 700 | 35.9 | |||
| Turnout | 1,950 | ||||
| Labour hold | Swing | ||||
| Party | Candidate | Votes | % | ±% | |
|---|---|---|---|---|---|
| Labour | Danny Millard | 915 | 51.4 | +7.0 | |
| Conservative | Shirley Ching | 544 | 30.5 | -0.6 | |
| UKIP | Ian Keeling | 287 | 16.1 | -8.4 | |
| Green | Ben Groom | 35 | 2.0 | +2.0 | |
| Majority | 371 | 20.8 | |||
| Turnout | 1,781 | ||||
| Labour hold | Swing | ||||
2018-2022 edit
| Party | Candidate | Votes | % | ±% | |
|---|---|---|---|---|---|
| Conservative | Emma Henlan | 986 | 52.6 | +20.7 | |
| Labour | Robert Hevican | 810 | 43.2 | -13.7 | |
| Independent | Energy Kutebura | 40 | 2.1 | +2.1 | |
| Liberal Democrats | Nicolas Bradley | 30 | 1.6 | +1.6 | |
| TUSC | Richard Gingell | 9 | 0.5 | +0.5 | |
| Majority | 176 | 9.4 | |||
| Turnout | 1,878 | 20.13 | |||
| Conservative gain from Labour | Swing | +17.2 | |||
2022-2026 edit
| Party | Candidate | Votes | % | ±% | |
|---|---|---|---|---|---|
| Labour | Jenny Chidley | 854 | 51.3 | -6.3 | |
| Conservative | Fajli Bibi | 654 | 39.3 | -3.1 | |
| Liberal Democrats | Manjit Singh Lall | 77 | 4.3 | +4.3 | |
| Green | Mark Nicholas Redding | 56 | 3.4 | +3.4 | |
| TUSC | Gareth Knox | 23 | 1.4 | +1.4 | |
| Majority | 200 | 12.0 | -3.2 | ||
| Turnout | 1,664 | 16.33 | -8.8 | ||
| Labour hold | Swing | ||||
References edit
- ^ a b "The Borough of Sandwell (Electoral Changes) Order 2003", legislation.gov.uk, The National Archives, SI 2003/2510, retrieved 12 September 2022
- ^ "Compositions calculator". The Elections Centre. Retrieved 9 September 2022.
- ^ "Sandwell". BBC News Online. 19 April 2008. Retrieved 3 October 2009.
- ^ "Council minutes". Sandwell Metropolitan Borough Council. Retrieved 12 September 2022.
- ^ "Tributes paid to former Sandwell Council leader". Birmingham Mail. 10 January 2013. Retrieved 12 September 2022.
- ^ "Council leader resigns over theft charge". Halesowen News. 23 October 2009. Retrieved 12 September 2022.
- ^ "Former Sandwell Council leader Bill Thomas OBE dies in Wales". Halesowen News. 26 March 2010. Retrieved 12 September 2022.
- ^ "Sandwell council leader Darren Cooper dies aged 52". ITV News. 27 March 2016. Retrieved 12 September 2022.
- ^ "Steve Eling resigns as Sandwell Council leader". Halesowen News. 14 February 2019. Retrieved 14 February 2019.
- ^ "Statement of Accounts 2018/19". Sandwell Metropolitan Borough Council. 30 September 2020. p. 14. Retrieved 12 September 2022.
- ^ Madeley, Peter (16 November 2021). "Sandwell Council leader steps down after six months in role". Express and Star. Retrieved 12 September 2022.
- ^ "Sandwell council". BBC News Online. Retrieved 3 October 2009.
- ^ "Election victory for Labour". Birmingham Mail. 23 October 1998. p. 4.
- ^ "By-election winner joins husband". Birmingham Mail. 16 July 1999. p. 6.
- ^ "Labour success". Birmingham Mail. 27 August 1999. p. 33.
- ^ a b Deeley, Tony (19 November 1999). "Double by-election blow for Labour Party". Birmingham Mail. p. 7.
- ^ "Re-election for councillor". Birmingham Mail. 9 June 2001. p. 11.
- ^ "Council man back after new poll win". Birmingham Mail. 7 September 2001. p. 5.
- ^ "Labour back in". Birmingham Mail. 20 September 2002. p. 10.
- ^ "Tories suffer triple defeat". guardian.co.uk. London. 26 November 2004. Retrieved 3 October 2009.
- ^ Deeley, Tony (29 June 2007). "Tory anger over by-election 'dirty tricks' ; Victory marred by 'smear campaign'". Birmingham Mail. p. 1.
- ^ "Labour win in Sandwell by-election thwarts BNP". Birmingham Mail. 7 December 2007. Retrieved 3 October 2009.
- ^ "Lib Dems are unseated ; Great Barr". Birmingham Mail. 25 January 2008. p. 29.
- ^ "Declaration of Result of Poll - Wednesbury South Ward". Sandwell Metropolitan Borough Council. Archived from the original on 5 October 2009. Retrieved 3 October 2009.
- ^ "Tories lose Wednesbury North seat after 36 years". BBC News Online. 19 November 2010. Retrieved 13 February 2011.
- ^ "Local Elections Archive Project — Newton Ward". www.andrewteale.me.uk. Retrieved 17 April 2022.
- ^ "Local Elections Archive Project — Blackheath Ward". www.andrewteale.me.uk. Retrieved 17 April 2022.
- ^ "Tividale By Election 15th July 2021". Sandwell Council. 16 July 2021. Retrieved 18 July 2021.
- ^ "Wednesbury South By-Election 27 October 2022". Sandwell Council. 28 October 2022. Retrieved 28 October 2022.
- By-election results
External links edit
- Sandwell Metropolitan Borough Council