


Summary
Sea ice concentration is a useful variable for climate scientists and nautical navigators. It is defined as the area of sea ice relative to the total at a given point in the ocean. This article will deal primarily with its determination from remote sensing measurements.
Significance edit
Sea ice concentration helps determine a number of other important climate variables. Since the albedo of ice is much higher than that of water, ice concentration will regulate insolation in the polar oceans. When combined with ice thickness, it determines several other important fluxes between the air and sea, such as salt and fresh-water fluxes between the polar oceans (see for instance bottom water) as well as heat transfer between the atmosphere. Maps of sea ice concentration can be used to determine Sea ice area and Sea ice extent, both of which are important markers of climate change.
Ice concentration charts are also used by navigators to determine potentially passable regions—see icebreaker.
Methods edit
In situ edit
Measurements from ships and aircraft are based on simply calculating the relative area of ice versus water visible within the scene. This can be done using photographs or by eye. In situ measurements are used to validate remote sensing measurements.
SAR and visible edit
Both synthetic aperture radar and visible sensors (such as Landsat) are normally high enough resolution that each pixel is simply classified as a distinct surface type, i.e. water versus ice. The concentration can then be determined by counting the number of ice pixels in a given area which is useful for validating concentration estimates from lower resolution instruments such as microwave radiometers. Since SAR images are normally monochrome and the backscatter of ice can vary quite considerably, classification is normally done based on texture using groups of pixels—see pattern recognition.
Visible sensors have the disadvantage of being quite weather sensitive—images are obscured by clouds—while SAR sensors, especially in the higher resolution modes, have a limited coverage and must be pointed. This is why the tool of choice for determining ice concentration is often a passive microwave sensor. [1] [2]
Microwave radiometry edit
All warm bodies emit electro-magnetic radiation: see thermal radiation. Since different objects will emit differently at different frequencies, we can often determine what type of object we are looking at based on its emitted radiation—see spectroscopy. This principle underlies all passive microwave sensors and most passive infrared sensors. Passive is used in the sense that the sensor only measures radiation that has been emitted by other objects but does not emit any of its own. (A SAR sensor, by contrast, is active.) SSMR and SSMI radiometers were flown on the Nimbus program and DMSP series of satellites.
Because clouds are translucent in the microwave regime, especially at lower frequencies, microwave radiometers are quite weather insensitive. Since most microwave radiometers operate along a polar orbit with a broad, sweeping scan, full ice maps of the polar regions where the swaths are largely overlapping can usually be obtained within one day. This frequency and reliability comes at the cost of a poor resolution: the angular field of view of an antenna is directly proportional to the wavelength and inversely proportional to the effective aperture area. Thus we need a large deflector dish to compensate for a low frequency .[1]
Most ice concentration algorithms based on microwave radiometry are predicated on the dual observation that: 1. different surface types have different, strongly clustered, microwave signatures and 2. the radiometric signature at the instrument head is a linear combination of that of the different surface types, with the weights taking on the values of the relative concentrations. If we form a vector space from each of the instrument channels in which all but one of the signatures of the different surface types are linearly independent, then it is straightforward to solve for the relative concentrations:

where is the radiometric signature at the instrument head (normally measured as a brightness temperature), is the signature of the nominal background surface type (normally water), is the signature of the ith surface type while Ci are the relative concentrations. [3] [4] [5]


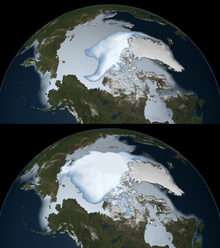
Every operational ice concentration algorithm is predicated on this principle or a slight variation. The NASA team algorithm, for instance, works by taking the difference of two channels and dividing by their sum. This makes the retrieval slightly nonlinear, but with the advantage that the influence of temperature is mitigated. This is because brightness temperature varies roughly linearly with physical temperature when all other things are equal—see emissivity—and because the sea ice emissivity at different microwave channels is strongly correlated.[3] As the equation suggests, concentrations of multiple ice types can potentially be detected, with NASA team distinguishing between first-year and multi-year ice (see image above). [6] [7]
Accuracies of sea ice concentration derived from passive microwave sensors may be expected to be on the order of 5\% (absolute). [6] [8] [9] A number of factors act to reduce the accuracy of the retrievals, the most obvious being variations in the microwave signatures produced by a given surface type. For sea ice, the presence of snow, variations in salt and moisture content, the presence of melt ponds as well as variations in surface temperature will all produce strong variations in the microwave signature of a given ice type. New and thin ice in particular will often have a microwave signature closer to that of open water. This is normally because of its high salt content, not because of radiation being transmitted from the water through the ice—see sea ice emissivity modelling. The presence of waves and surface roughness will change the signature over open water. Adverse weather conditions, clouds and humidity in particular, will also tend to reduce the accuracy of retrievals.[4]
See also edit
References edit
- ^ a b F. T. Ulaby; R. K. Moore; A. K. Fung, eds. (1986). Microwave Remote Sensing, Active and Passive. London, England: Addison Wesley.
- ^ W. B. Tucker; D. K. Prerovich; A. J. Gow; W. F. Weeks; M. R. Drinkwater (eds.). Microwave Remote Sensing of Sea Ice. American Geophysical Union.
- ^ a b D. A. Rothrock; D. R. Thomas & A. S. Thorndike, AS (1988). "Principal Component Analysis of Satellite Passive Microwave Data Over Sea Ice". Journal of Geophysical Research. 93 (C3): 2321–2332. Bibcode:1988JGR....93.2321R. doi:10.1029/JC093iC03p02321.
- ^ a b G. Heygster; S. Hendricks; L. Kaleschke; N. Maass; et al. (2009). L-Band Radiometry for Sea-Ice Applications (Technical report). Institute of Environmental Physics, University of Bremen. ESA/ESTEC Contract N. 21130/08/NL/EL.
- ^ P. Mills & G. Heygster (2010). "Retrieving sea ice concentration from SMOS" (PDF). IEEE Transactions on Geoscience and Remote Sensing. 8 (2): 283–287. doi:10.1109/LGRS.2010.2064157. S2CID 21337433.
- ^ a b J. C. Comiso; D. J. Cavalieri; C. L. Parkinson & P. Gloersen (1997). "Passive microwave algorithms for sea ice concentration: A comparison of two techniques". Remote Sensing of Environment. 60 (3): 357–384. Bibcode:1997RSEnv..60..357C. doi:10.1016/S0034-4257(96)00220-9.
- ^ T. Markus & D. J. Cavalieri (2000). "An Enhancement of the NASA Team Sea Ice Algorithm". IEEE Transactions on Geoscience and Remote Sensing. 38 (3): 1387–1398. Bibcode:2000ITGRS..38.1387M. doi:10.1109/36.843033.
- ^ S. Andersen; R. T. Tonboe; S. Kern & H. Schyberg (2006). "Improved retrieval of sea ice total concentration from spaceborne passive microwave observations using numerical weather prediction model fields: An intercomparison of nine algorithms". Remote Sensing of Environment. 104 (4): 374–392. Bibcode:2006RSEnv.104..374A. doi:10.1016/j.rse.2006.05.013.
- ^ G. Heygster; H. Wiebe; G. Spreen & L. Kaleschke (2009). "AMSR-E Geolocation and Validation of Sea Ice Concentrations Based on 89 GHz data". Journal of the Remote Sensing Society of Japan. 29 (1): 226–235.
External links edit
- High-resolution sea ice concentration charts derived from AMSR-E 89 GHz channel
- The Arctic ice sheet True color satellite map with daily updates.