
KNOWPIA
WELCOME TO KNOWPIA

Sishui County 
Summary
Sishui County (simplified Chinese: 泗水县; traditional Chinese: 泗水縣; pinyin: Sìshuǐ Xiàn) is a county of southwestern Shandong province, People's Republic of China. It is the easternmost county-level division of Jining City. It takes its name from the Si River, which flows through the county.
Sishui County
泗水县 Szeshui | |
|---|---|
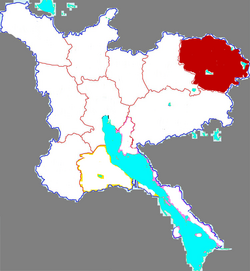 Location in Jining | |
 Sishui Location of the seat in Shandong | |
| Coordinates: 35°39′50″N 117°15′04″E / 35.664°N 117.251°E | |
| Country | People's Republic of China |
| Province | Shandong |
| Prefecture-level city | Jining |
| Area | |
| • Total | 1,118.11 km2 (431.70 sq mi) |
| Elevation | 105 m (344 ft) |
| Population (2017) | |
| • Total | 552,300 |
| • Density | 490/km2 (1,300/sq mi) |
| Time zone | UTC+8 (China Standard) |
| Postal code | 273200 |
| Website | www |
The population was 590,326 in 1999.[1]
Administrative divisions edit
As 2012, this county is divided to 2 subdistricts, 8 towns and 3 townships.[2]
- Subdistricts
- Sihe Subdistrict (泗河街道)
- Jihe Subdistrict (济河街道)
- Towns
|
|
- Townships
- Shengshuiyu Township (圣水峪乡)
- Dahuanggou Township (大黄沟乡)
- Gaoyu Township (高峪乡)
Climate edit
| Climate data for Sishui (1991–2020 normals, extremes 1981–2010) | |||||||||||||
|---|---|---|---|---|---|---|---|---|---|---|---|---|---|
| Month | Jan | Feb | Mar | Apr | May | Jun | Jul | Aug | Sep | Oct | Nov | Dec | Year |
| Record high °C (°F) | 18.5 (65.3) |
23.2 (73.8) |
28.8 (83.8) |
33.5 (92.3) |
37.5 (99.5) |
39.6 (103.3) |
41.3 (106.3) |
37.5 (99.5) |
36.4 (97.5) |
34.7 (94.5) |
26.1 (79.0) |
19.0 (66.2) |
41.3 (106.3) |
| Mean daily maximum °C (°F) | 5.0 (41.0) |
8.6 (47.5) |
14.9 (58.8) |
21.8 (71.2) |
27.3 (81.1) |
31.3 (88.3) |
31.9 (89.4) |
30.8 (87.4) |
27.2 (81.0) |
21.5 (70.7) |
13.6 (56.5) |
6.8 (44.2) |
20.1 (68.1) |
| Daily mean °C (°F) | −0.5 (31.1) |
2.8 (37.0) |
8.8 (47.8) |
15.7 (60.3) |
21.4 (70.5) |
25.6 (78.1) |
27.3 (81.1) |
26.1 (79.0) |
21.6 (70.9) |
15.2 (59.4) |
7.8 (46.0) |
1.3 (34.3) |
14.4 (58.0) |
| Mean daily minimum °C (°F) | −4.6 (23.7) |
−1.8 (28.8) |
3.4 (38.1) |
9.7 (49.5) |
15.4 (59.7) |
20.2 (68.4) |
23.3 (73.9) |
22.2 (72.0) |
17.0 (62.6) |
10.2 (50.4) |
3.2 (37.8) |
−2.8 (27.0) |
9.6 (49.3) |
| Record low °C (°F) | −16.7 (1.9) |
−14.4 (6.1) |
−11.2 (11.8) |
−2.4 (27.7) |
3.6 (38.5) |
9.9 (49.8) |
16.7 (62.1) |
12.5 (54.5) |
6.1 (43.0) |
−3.3 (26.1) |
−11.4 (11.5) |
−15.4 (4.3) |
−16.7 (1.9) |
| Average precipitation mm (inches) | 7.2 (0.28) |
13.1 (0.52) |
15.2 (0.60) |
36.4 (1.43) |
55.4 (2.18) |
88.8 (3.50) |
211.6 (8.33) |
195.8 (7.71) |
69.9 (2.75) |
29.9 (1.18) |
28.6 (1.13) |
10.1 (0.40) |
762 (30.01) |
| Average precipitation days (≥ 0.1 mm) | 2.9 | 3.8 | 3.7 | 5.5 | 6.9 | 7.7 | 11.8 | 11.5 | 7.4 | 5.3 | 5.0 | 3.4 | 74.9 |
| Average snowy days | 2.7 | 2.6 | 0.7 | 0.2 | 0 | 0 | 0 | 0 | 0 | 0 | 0.9 | 1.7 | 8.8 |
| Average relative humidity (%) | 60 | 56 | 51 | 54 | 58 | 62 | 77 | 79 | 73 | 68 | 66 | 63 | 64 |
| Mean monthly sunshine hours | 151.9 | 155.0 | 198.4 | 216.5 | 233.5 | 203.3 | 180.7 | 179.3 | 180.3 | 179.7 | 155.7 | 153.5 | 2,187.8 |
| Percent possible sunshine | 49 | 50 | 53 | 55 | 53 | 47 | 41 | 43 | 49 | 52 | 51 | 51 | 50 |
| Source: China Meteorological Administration[3][4] | |||||||||||||
References edit
- ^ National Population Statistics Materials by County and City - 1999 Period, in China County & City Population 1999, Harvard China Historical GIS
- ^ 济宁市-行政区划网 www.xzqh.org (in Chinese). XZQH. Retrieved 2012-05-24.
- ^ 中国气象数据网 – WeatherBk Data (in Simplified Chinese). China Meteorological Administration. Retrieved 12 August 2023.
- ^ 中国气象数据网 (in Simplified Chinese). China Meteorological Administration. Retrieved 12 August 2023.
External links edit
- Official homepage