


Summary
South Miami Heights is a census-designated place (CDP), originally known as Eureka, in Miami-Dade County, Florida. It is part of the Miami metropolitan area of South Florida. The population was 36,770 as of the 2020 census.[2]
South Miami Heights, Florida | |
|---|---|
 South Miami Heights in 1972 | |
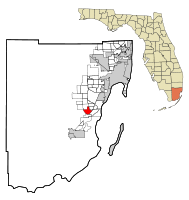 Location in Miami-Dade County and the state of Florida | |
 U.S. Census Bureau map showing CDP boundaries | |
| Coordinates: 25°35′20″N 80°23′7″W / 25.58889°N 80.38528°W | |
| Country | |
| State | |
| County | |
| Area | |
| • Total | 4.98 sq mi (12.91 km2) |
| • Land | 4.91 sq mi (12.71 km2) |
| • Water | 0.08 sq mi (0.20 km2) |
| Elevation | 10 ft (3 m) |
| Population | |
| • Total | 36,770 |
| • Density | 7,491.85/sq mi (2,892.74/km2) |
| Time zone | UTC-5 (Eastern (EST)) |
| • Summer (DST) | UTC-4 (EDT) |
| ZIP codes | 33157, 33177, 33189 (Miami) |
| Area code(s) | 305, 786, 645 |
| FIPS code | 12-67575[3] |
| GNIS feature ID | 0291396[4] |
Geography edit
South Miami Heights is located 17 miles (27 km) southwest of downtown Miami at 25°35′20″N 80°23′7″W / 25.58889°N 80.38528°W (25.588784, -80.385209).[5] It is bordered to the east by Cutler Bay, to the south by Goulds, to the northwest by Richmond West, and to the northeast by West Perrine. It is bordered to the north by Thompson Memorial Park and Zoo Miami.
According to the United States Census Bureau, the CDP has a total area of 5.0 square miles (13 km2), of which 0.08 square miles (0.21 km2), or 1.52%, are water.[1]
Demographics edit
| Census | Pop. | Note | %± |
|---|---|---|---|
| 1970 | 10,395 | — | |
| 1980 | 23,559 | 126.6% | |
| 1990 | 30,030 | 27.5% | |
| 2000 | 33,522 | 11.6% | |
| 2010 | 35,696 | 6.5% | |
| 2020 | 36,770 | 3.0% | |
| source:[6] | |||
2010 and 2020 census edit
| Race | Pop 2010[7] | Pop 2020[8] | % 2010 | % 2020 |
|---|---|---|---|---|
| White (NH) | 2,561 | 2,119 | 7.17% | 5.76% |
| Black or African American (NH) | 7,792 | 5,285 | 21.83% | 14.37% |
| Native American or Alaska Native (NH) | 47 | 31 | 0.13% | 0.08% |
| Asian (NH) | 514 | 444 | 1.44% | 1.21% |
| Pacific Islander or Native Hawaiian (NH) | 4 | 2 | 0.01% | 0.01% |
| Some other race (NH) | 127 | 231 | 0.36% | 0.63% |
| Two or more races/Multiracial (NH) | 393 | 433 | 1.10% | 1.18% |
| Hispanic or Latino (any race) | 24,258 | 28,225 | 67.96% | 76.76% |
| Total | 35,696 | 36,770 | 100.00% | 100.00% |
As of the 2020 United States census, there were 36,770 people, 10,769 households, and 8,265 families residing in the CDP.[9]
As of the 2010 United States census, there were 35,696 people, 10,558 households, and 8,485 families residing in the CDP.[10]
2000 census edit
As of the census[3] of 2000, there were 33,522 people, 9,931 households, and 7,994 families residing in the CDP. The population density was 6,800.4 people per square mile (2,625.3/km2). There were 10,364 housing units at an average density of 2,102.5/sq mi (811.7/km2). The racial makeup of the CDP was 55.47% White (11.2% Non-Hispanic White),[11] 30.32% African American, 0.28% Native American, 1.83% Asian, 0.02% Pacific Islander, 6.85% from other races, and 5.23% from two or more races. Hispanic or Latino of any race were 56.17% of the population.
As of 2000, there were 9,931 households out of which 43.7% had children under the age of 18 living with them, 51.3% were married couples living together, 22.7% had a female householder with no husband present, and 19.5% were non-families. 15.6% of all households were made up of individuals and 6.2% had someone living alone who was 65 years of age or older. The average household size was 3.34 and the average family size was 3.68.
In 2000, in the CDP the population was spread out with 30.6% under the age of 18, 9.8% from 18 to 24, 29.3% from 25 to 44, 20.8% from 45 to 64, and 9.5% who were 65 years of age or older. The median age was 32 years. For every 100 females there were 93.3 males. For every 100 females age 18 and over, there were 88.4 males.
In 2000, the median income for a household in the CDP was $34,899, and the median income for a family was $37,457. Males had a median income of $25,768 versus $22,080 for females. The per capita income for the CDP was $12,315. About 14.8% of families and 17.2% of the population were below the poverty line, including 20.9% of those under age 18 and 24.3% of those age 65 or over.
As of 2000, speakers of Spanish as a first language accounted for 58.06% of residents, while English made up 40.16%, French was at 0.94%, and French Creole was the mother tongue of 0.81% of the population.[12]
References edit
- ^ a b "2022 U.S. Gazetteer Files: Florida". United States Census Bureau. Retrieved January 13, 2023.
- ^ a b "P1. Race – South Miami Heights CDP, Florida: 2020 DEC Redistricting Data (PL 94-171)". U.S. Census Bureau. Retrieved January 13, 2023.
- ^ a b "U.S. Census website". United States Census Bureau. Retrieved January 31, 2008.
- ^ "US Board on Geographic Names". United States Geological Survey. October 25, 2007. Retrieved January 31, 2008.
- ^ "US Gazetteer files: 2010, 2000, and 1990". United States Census Bureau. February 12, 2011. Retrieved April 23, 2011.
- ^ "CENSUS OF POPULATION AND HOUSING (1790-2000)". U.S. Census Bureau. Retrieved July 17, 2010.
- ^ "P2 HISPANIC OR LATINO, AND NOT HISPANIC OR LATINO BY RACE - 2010: DEC Redistricting Data (PL 94-171) - South Miami Heights CDP, Florida". United States Census Bureau.
- ^ "P2 HISPANIC OR LATINO, AND NOT HISPANIC OR LATINO BY RACE - 2020: DEC Redistricting Data (PL 94-171) - South Miami Heights CDP, Florida". United States Census Bureau.
- ^ "S1101 HOUSEHOLDS AND FAMILIES - 2020: South Miami Heights CDP, Florida". United States Census Bureau.
- ^ "S1101 HOUSEHOLDS AND FAMILIES - 2010: South Miami Heights CDP, Florida". United States Census Bureau.
- ^ "Demographics of South Miami Heights, FL". MuniNetGuide.com. Retrieved November 9, 2007.
- ^ "MLA Data Center Results of South Miami Heights, FL". Modern Language Association. Retrieved November 9, 2007.