


Summary
Spectroscopy is the field of study that measures and interprets electromagnetic spectra.[1][2] In narrower contexts, spectroscopy is the precise study of color as generalized from visible light to all bands of the electromagnetic spectrum.
Spectroscopy, primarily in the electromagnetic spectrum, is a fundamental exploratory tool in the fields of astronomy, chemistry, materials science, and physics, allowing the composition, physical structure and electronic structure of matter to be investigated at the atomic, molecular and macro scale, and over astronomical distances.
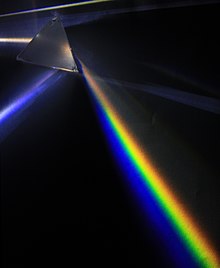
Historically, spectroscopy originated as the study of the wavelength dependence of the absorption by gas phase matter of visible light dispersed by a prism. Current applications of spectroscopy include biomedical spectroscopy in the areas of tissue analysis and medical imaging. Matter waves and acoustic waves can also be considered forms of radiative energy, and recently gravitational waves have been associated with a spectral signature in the context of the Laser Interferometer Gravitational-Wave Observatory (LIGO).[3]
Introduction edit
Spectroscopy is a branch of science concerned with the spectra of electromagnetic radiation as a function of its wavelength or frequency measured by spectrographic equipment, and other techniques, in order to obtain information concerning the structure and properties of matter.[4] Spectral measurement devices are referred to as spectrometers, spectrophotometers, spectrographs or spectral analyzers. Most spectroscopic analysis in the laboratory starts with a sample to be analyzed, then a light source is chosen from any desired range of the light spectrum, then the light goes through the sample to a dispersion array (diffraction grating instrument) and captured by a photodiode. For astronomical purposes, the telescope must be equipped with the light dispersion device. There are various versions of this basic setup that may be employed.
Spectroscopy began with Isaac Newton splitting light with a prism; a key moment in the development of modern optics.[5] Therefore, it was originally the study of visible light which we call color that later under the studies of James Clerk Maxwell came to include the entire electromagnetic spectrum.[6] Although color is involved in spectroscopy, it is not equated with the color of elements or objects which involve the absorption and reflection of certain electromagnetic waves to give objects a sense of color to our eyes. Rather spectroscopy involves the splitting of light by a prism, diffraction grating, or similar instrument, to give off a particular discrete line pattern called a "spectrum" unique to each different type of element. Most elements are first put into a gaseous phase to allow the spectra to be examined although today other methods can be used on different phases. Each element that is diffracted by a prism-like instrument displays either an absorption spectrum or an emission spectrum depending upon whether the element is being cooled or heated.[7]
Until recently all spectroscopy involved the study of line spectra and most spectroscopy still does.[8] Vibrational spectroscopy is the branch of spectroscopy that studies the spectra.[9] However, the latest developments in spectroscopy can sometimes dispense with the dispersion technique. In biochemical spectroscopy, information can be gathered about biological tissue by absorption and light scattering techniques. Light scattering spectroscopy is a type of reflectance spectroscopy that determines tissue structures by examining elastic scattering.[10] In such a case, it is the tissue that acts as a diffraction or dispersion mechanism.
Spectroscopic studies were central to the development of quantum mechanics, because the first useful atomic models described the spectra of hydrogen which models include the Bohr model, the Schrödinger equation, and Matrix mechanics which all can produce the spectral lines of hydrogen, therefore providing the basis for discrete quantum jumps to match the discrete hydrogen spectrum. Also, Max Planck's explanation of blackbody radiation involved spectroscopy because he was comparing the wavelength of light using a photometer to the temperature of a Black Body.[11] Spectroscopy is used in physical and analytical chemistry because atoms and molecules have unique spectra. As a result, these spectra can be used to detect, identify and quantify information about the atoms and molecules. Spectroscopy is also used in astronomy and remote sensing on Earth. Most research telescopes have spectrographs. The measured spectra are used to determine the chemical composition and physical properties of astronomical objects (such as their temperature, density of elements in a star, velocity, black holes and more).[12] An important use for spectroscopy is in biochemistry. Molecular samples may be analyzed for species identification and energy content.[13]
Theory edit
The underlying premise of spectroscopy is that light is made of different wavelengths and that each wavelength corresponds to a different frequency. The importance of spectroscopy is centered around the fact that every element in the periodic table has a unique light spectrum described by the frequencies of light it emits or absorbs consistently appearing in the same part of the electromagnetic spectrum when that light is diffracted. This opened up an entire field of study with anything that contains atoms which is all matter. Spectroscopy is the key to understanding the atomic properties of all matter. As such spectroscopy opened up many new sub-fields of science yet undiscovered. The idea that each atomic element has its unique spectral signature enabled spectroscopy to be used in a broad number of fields each with a specific goal achieved by different spectroscopic procedures. The National Institute of Standards and Technology maintains a public Atomic Spectra Database that is continually updated with precise measurements.[14]
The broadening of the field of spectroscopy is due to the fact that any part of the electromagnetic spectrum may be used to analyze a sample from the infrared to the ultraviolet telling scientists different properties about the very same sample. For instance in chemical analysis, the most common types of spectroscopy include atomic spectroscopy, infrared spectroscopy, ultraviolet and visible spectroscopy, Raman spectroscopy and nuclear magnetic resonance.[15] In nuclear magnetic resonance (NMR), the theory behind it is that frequency is analogous to resonance and its corresponding resonant frequency. Resonances by the frequency were first characterized in mechanical systems such as pendulums which have a frequency of motion noted famously by Galileo.[16]
Classification of methods edit

Spectroscopy is a sufficiently broad field that many sub-disciplines exist, each with numerous implementations of specific spectroscopic techniques. The various implementations and techniques can be classified in several ways.
Type of radiative energy edit
The types of spectroscopy are distinguished by the type of radiative energy involved in the interaction. In many applications, the spectrum is determined by measuring changes in the intensity or frequency of this energy. The types of radiative energy studied include:
- Electromagnetic radiation was the first source of energy used for spectroscopic studies. Techniques that employ electromagnetic radiation are typically classified by the wavelength region of the spectrum and include microwave, terahertz, infrared, near-infrared, ultraviolet-visible, x-ray, and gamma spectroscopy.
- Particles, because of their de Broglie waves, can also be a source of radiative energy. Both electron and neutron spectroscopy are commonly used. For a particle, its kinetic energy determines its wavelength.
- Acoustic spectroscopy involves radiated pressure waves.
- Dynamic mechanical analysis can be employed to impart radiating energy, similar to acoustic waves, to solid materials.
Nature of the interaction edit
The types of spectroscopy also can be distinguished by the nature of the interaction between the energy and the material. These interactions include:[2]
- Absorption spectroscopy: Absorption occurs when energy from the radiative source is absorbed by the material. Absorption is often determined by measuring the fraction of energy transmitted through the material, with absorption decreasing the transmitted portion.
- Emission spectroscopy: Emission indicates that radiative energy is released by the material. A material's blackbody spectrum is a spontaneous emission spectrum determined by its temperature. This feature can be measured in the infrared by instruments such as the atmospheric emitted radiance interferometer.[18] Emission can also be induced by other sources of energy such as flames, sparks, electric arcs or electromagnetic radiation in the case of fluorescence.
- Elastic scattering and reflection spectroscopy determine how incident radiation is reflected or scattered by a material. Crystallography employs the scattering of high energy radiation, such as x-rays and electrons, to examine the arrangement of atoms in proteins and solid crystals.
- Impedance spectroscopy: Impedance is the ability of a medium to impede or slow the transmittance of energy. For optical applications, this is characterized by the index of refraction.
- Inelastic scattering phenomena involve an exchange of energy between the radiation and the matter that shifts the wavelength of the scattered radiation. These include Raman and Compton scattering.
- Coherent or resonance spectroscopy are techniques where the radiative energy couples two quantum states of the material in a coherent interaction that is sustained by the radiating field. The coherence can be disrupted by other interactions, such as particle collisions and energy transfer, and so often require high intensity radiation to be sustained. Nuclear magnetic resonance (NMR) spectroscopy is a widely used resonance method, and ultrafast laser spectroscopy is also possible in the infrared and visible spectral regions.
- Nuclear spectroscopy are methods that use the properties of specific nuclei to probe the local structure in matter, mainly condensed matter, molecules in liquids or frozen liquids and bio-molecules.
- Quantum logic spectroscopy is a general technique used in ion traps which enables precision spectroscopy of ions with internal structures that preclude laser cooling, state manipulation, and detection. Quantum logic operations enable a controllable ion to exchange information with a co-trapped ion that has a complex or unknown electronic structure.
Type of material edit
Spectroscopic studies are designed so that the radiant energy interacts with specific types of matter.
Atoms edit
Atomic spectroscopy was the first application of spectroscopy. Atomic absorption spectroscopy and atomic emission spectroscopy involve visible and ultraviolet light. These absorptions and emissions, often referred to as atomic spectral lines, are due to electronic transitions of outer shell electrons as they rise and fall from one electron orbit to another. Atoms also have distinct x-ray spectra that are attributable to the excitation of inner shell electrons to excited states.
Atoms of different elements have distinct spectra and therefore atomic spectroscopy allows for the identification and quantitation of a sample's elemental composition. After inventing the spectroscope, Robert Bunsen and Gustav Kirchhoff discovered new elements by observing their emission spectra. Atomic absorption lines are observed in the solar spectrum and referred to as Fraunhofer lines after their discoverer. A comprehensive explanation of the hydrogen spectrum was an early success of quantum mechanics and explained the Lamb shift observed in the hydrogen spectrum, which further led to the development of quantum electrodynamics.
Modern implementations of atomic spectroscopy for studying visible and ultraviolet transitions include flame emission spectroscopy, inductively coupled plasma atomic emission spectroscopy, glow discharge spectroscopy, microwave induced plasma spectroscopy, and spark or arc emission spectroscopy. Techniques for studying x-ray spectra include X-ray spectroscopy and X-ray fluorescence.
Molecules edit
The combination of atoms into molecules leads to the creation of unique types of energetic states and therefore unique spectra of the transitions between these states. Molecular spectra can be obtained due to electron spin states (electron paramagnetic resonance), molecular rotations, molecular vibration, and electronic states. Rotations are collective motions of the atomic nuclei and typically lead to spectra in the microwave and millimeter-wave spectral regions. Rotational spectroscopy and microwave spectroscopy are synonymous. Vibrations are relative motions of the atomic nuclei and are studied by both infrared and Raman spectroscopy. Electronic excitations are studied using visible and ultraviolet spectroscopy as well as fluorescence spectroscopy.[2][19][20][21][22]
Studies in molecular spectroscopy led to the development of the first maser and contributed to the subsequent development of the laser.
Crystals and extended materials edit
The combination of atoms or molecules into crystals or other extended forms leads to the creation of additional energetic states. These states are numerous and therefore have a high density of states. This high density often makes the spectra weaker and less distinct, i.e., broader. For instance, blackbody radiation is due to the thermal motions of atoms and molecules within a material. Acoustic and mechanical responses are due to collective motions as well. Pure crystals, though, can have distinct spectral transitions, and the crystal arrangement also has an effect on the observed molecular spectra. The regular lattice structure of crystals also scatters x-rays, electrons or neutrons allowing for crystallographic studies.
Nuclei edit
Nuclei also have distinct energy states that are widely separated and lead to gamma ray spectra. Distinct nuclear spin states can have their energy separated by a magnetic field, and this allows for nuclear magnetic resonance spectroscopy.
Other types edit
Other types of spectroscopy are distinguished by specific applications or implementations:
- Acoustic resonance spectroscopy is based on sound waves primarily in the audible and ultrasonic regions.
- Auger electron spectroscopy is a method used to study surfaces of materials on a micro-scale. It is often used in connection with electron microscopy.
- Cavity ring-down spectroscopy
- Circular dichroism spectroscopy
- Coherent anti-Stokes Raman spectroscopy is a recent technique that has high sensitivity and powerful applications for in vivo spectroscopy and imaging.[23]
- Cold vapour atomic fluorescence spectroscopy
- Correlation spectroscopy encompasses several types of two-dimensional NMR spectroscopy.
- Deep-level transient spectroscopy measures concentration and analyzes parameters of electrically active defects in semiconducting materials.
- Dielectric spectroscopy
- Dual-polarization interferometry measures the real and imaginary components of the complex refractive index.
- Electron energy loss spectroscopy in transmission electron microscopy.
- Electron phenomenological spectroscopy measures the physicochemical properties and characteristics of the electronic structure of multicomponent and complex molecular systems.
- Electron paramagnetic resonance spectroscopy
- Force spectroscopy
- Fourier-transform spectroscopy is an efficient method for processing spectra data obtained using interferometers. Fourier-transform infrared spectroscopy is a common implementation of infrared spectroscopy. NMR also employs Fourier transforms.
- Gamma spectroscopy
- Hadron spectroscopy studies the energy/mass spectrum of hadrons according to spin, parity, and other particle properties. Baryon spectroscopy and meson spectroscopy are types of hadron spectroscopy.
- Multispectral imaging and hyperspectral imaging is a method to create a complete picture of the environment or various objects, each pixel containing a full visible, visible near infrared, near infrared, or infrared spectrum.
- Inelastic electron tunneling spectroscopy uses the changes in current due to inelastic electron-vibration interaction at specific energies that can also measure optically forbidden transitions.
- Inelastic neutron scattering is similar to Raman spectroscopy, but uses neutrons instead of photons.
- Laser-induced breakdown spectroscopy, also called laser-induced plasma spectrometry
- Laser spectroscopy uses tunable lasers[24] and other types of coherent emission sources, such as optical parametric oscillators,[25] for selective excitation of atomic or molecular species.
- Light scattering spectroscopy (LSS) is a spectroscopic technique typically used to evaluate morphological changes in epithelial cells in order to study mucosal tissue and detect early cancer and precancer.[10][26]
- Mass spectroscopy is a historical term used to refer to mass spectrometry. The current recommendation is to use the latter term.[27] The term "mass spectroscopy" originated in the use of phosphor screens to detect ions.
- Mössbauer spectroscopy probes the properties of specific isotopic nuclei in different atomic environments by analyzing the resonant absorption of gamma rays. See also Mössbauer effect.
- Multivariate optical computing is an all optical compressed sensing technique, generally used in harsh environments, that directly calculates chemical information from a spectrum as analogue output.
- Neutron spin echo spectroscopy measures internal dynamics in proteins and other soft matter systems.
- Nuclear quadrupole resonance is a chemical spectroscopy method mediated by NMR of the electric field gradient (EFG) in the absence of magnetic field
- Perturbed angular correlation (PAC) uses radioactive nuclei as probe to study electric and magnetic fields (hyperfine interactions) in crystals (condensed matter) and bio-molecules.
- Photoacoustic spectroscopy measures the sound waves produced upon the absorption of radiation.
- Photoemission spectroscopy
- Photothermal spectroscopy measures heat evolved upon absorption of radiation.
- Pump-probe spectroscopy can use ultrafast laser pulses to measure reaction intermediates in the femtosecond timescale.
- Raman optical activity spectroscopy exploits Raman scattering and optical activity effects to reveal detailed information on chiral centers in molecules.
- Raman spectroscopy
- Saturated spectroscopy
- Scanning tunneling spectroscopy
- Spectrophotometry
- Spin noise spectroscopy traces spontaneous fluctuations of electronic and nuclear spins.[28]
- Time-resolved spectroscopy measures the decay rates of excited states using various spectroscopic methods.
- Time-stretch spectroscopy[29][30]
- Thermal infrared spectroscopy measures thermal radiation emitted from materials and surfaces and is used to determine the type of bonds present in a sample as well as their lattice environment. The techniques are widely used by organic chemists, mineralogists, and planetary scientists.
- Transient grating spectroscopy measures quasiparticle propagation. It can track changes in metallic materials as they are irradiated.
- Ultraviolet photoelectron spectroscopy
- Ultraviolet–visible spectroscopy
- Vibrational circular dichroism spectroscopy
- Video spectroscopy
- X-ray photoelectron spectroscopy
Applications edit
There are several applications of spectroscopy in the fields of medicine, physics, chemistry, and astronomy. Taking advantage of the properties of absorbance and with astronomy emission, spectroscopy can be used to identify certain states of nature. The uses of spectroscopy in so many different fields and for so many different applications has caused specialty scientific subfields. Such examples include:
- Determining the atomic structure of a sample[32]
- Studying spectral emission lines of the sun and distant galaxies[33]
- Space exploration
- Cure monitoring of composites using optical fibers.
- Estimating weathered wood exposure times using near infrared spectroscopy.[34]
- Measurement of different compounds in food samples by absorption spectroscopy both in visible and infrared spectrum.
- Measurement of toxic compounds in blood samples
- Non-destructive elemental analysis by X-ray fluorescence.
- Electronic structure research with various spectroscopes.
- Redshift to determine the speed and velocity of a distant object
- Determining the metabolic structure of a muscle
- Monitoring dissolved oxygen content in freshwater and marine ecosystems
- Altering the structure of drugs to improve effectiveness
- Characterization of proteins
- Respiratory gas analysis in hospitals[7]
- Finding the physical properties of a distant star or nearby exoplanet using the Relativistic Doppler effect.[35]
- In-ovo sexing: spectroscopy allows to determine the sex of the egg while it is hatching. Developed by French and German companies, both countries decided to ban chick culling, mostly done through a macerator, in 2022.[36]
- Process monitoring in Industrial process control[37]
History edit
The history of spectroscopy began with Isaac Newton's optics experiments (1666–1672). According to Andrew Fraknoi and David Morrison, "In 1672, in the first paper that he submitted to the Royal Society, Isaac Newton described an experiment in which he permitted sunlight to pass through a small hole and then through a prism. Newton found that sunlight, which looks white to us, is actually made up of a mixture of all the colors of the rainbow."[38] Newton applied the word "spectrum" to describe the rainbow of colors that combine to form white light and that are revealed when the white light is passed through a prism.
Fraknoi and Morrison state that "In 1802, William Hyde Wollaston built an improved spectrometer that included a lens to focus the Sun's spectrum on a screen. Upon use, Wollaston realized that the colors were not spread uniformly, but instead had missing patches of colors, which appeared as dark bands in the spectrum."[38] During the early 1800s, Joseph von Fraunhofer made experimental advances with dispersive spectrometers that enabled spectroscopy to become a more precise and quantitative scientific technique. Since then, spectroscopy has played and continues to play a significant role in chemistry, physics, and astronomy. Per Fraknoi and Morrison, "Later, in 1815, German physicist Joseph Fraunhofer also examined the solar spectrum, and found about 600 such dark lines (missing colors), are now known as Fraunhofer lines, or Absorption lines."[38][better source needed]
In quantum mechanical systems, the analogous resonance is a coupling of two quantum mechanical stationary states of one system, such as an atom, via an oscillatory source of energy such as a photon. The coupling of the two states is strongest when the energy of the source matches the energy difference between the two states. The energy E of a photon is related to its frequency ν by E = hν where h is Planck's constant, and so a spectrum of the system response vs. photon frequency will peak at the resonant frequency or energy. Particles such as electrons and neutrons have a comparable relationship, the de Broglie relations, between their kinetic energy and their wavelength and frequency and therefore can also excite resonant interactions.
Spectra of atoms and molecules often consist of a series of spectral lines, each one representing a resonance between two different quantum states. The explanation of these series, and the spectral patterns associated with them, were one of the experimental enigmas that drove the development and acceptance of quantum mechanics. The hydrogen spectral series in particular was first successfully explained by the Rutherford–Bohr quantum model of the hydrogen atom. In some cases spectral lines are well separated and distinguishable, but spectral lines can also overlap and appear to be a single transition if the density of energy states is high enough. Named series of lines include the principal, sharp, diffuse and fundamental series.
See also edit
- Applied spectroscopy
- Astronomical spectroscopy
- Atomic spectroscopy
- Biomedical spectroscopy
- Coronium
- Frances Lowater
- Least-squares spectral analysis
- List of spectroscopists
- Metamerism (color)
- Operando spectroscopy
- Scattering theory
- Spectral line ratios
- Spectral power distribution
- Spectral theory
- Spectroscopic notation
- Telluric contamination
- Virtually imaged phased array
Notes edit
- ^ Duckett, Simon; Gilbert, Bruce (2000). Foundations of Spectroscopy. Oxford Science Publications. ISBN 978-0198503354.
- ^ a b c Crouch, Stanley R.; Skoog, Douglas A.; Holler, F. J. (2007). Principles of instrumental analysis. Australia: Thomson Brooks/Cole. ISBN 9780495012016.
- ^ Bartusiak, Marcia (2017-06-27), "Einstein's Unfinished Symphony: The Story of a Gamble, Two Black Holes, and a New Age of Astronomy", Einstein’s Unfinished Symphony, Yale University Press, doi:10.12987/9780300228120, ISBN 9780300228120, OCLC 1039140043, S2CID 246149887, retrieved 2023-05-22 Google Books
- ^ The Oxford American College Dictionary. G.P. Putnam's Sons. 2002. ISBN 9780399144158. OCLC 48965005.
- ^ "Isaac Newton and the problem of color", Steven A. Edwards, AAAS.
- ^ "1861: James Clerk Maxwell's greatest year". King's College London. 18 April 2011. Archived from the original on 22 June 2013. Retrieved 28 March 2013.
- ^ a b PASCO, "What is Spectroscopy?"
- ^ Sutton, M. A. "Sir John Herschel and the Development of Spectroscopy in Britain". The British Journal for the History of Science, vol. 7, no. 1, [Cambridge University Press, The British Society for the History of Science], 1974, pp. 42–60.
- ^ Lazić, Dejan. "Introduction to Raman Microscopy/Spectroscopy." Application of Molecular Methods and Raman Microscopy/Spectroscopy in Agricultural Sciences and Food Technology, edited by Dejan Lazić et al., Ubiquity Press, 2019, pp. 143–50, http://www.jstor.org/stable/j.ctvmd85qp.12.
- ^ a b Perelman, L. T.; Backman, V.; Wallace, M.; Zonios, G.; Manoharan, R.; Nusrat, A.; Shields, S.; Seiler, M.; Lima, C.; Hamano, T.; Itzkan, I.; Van Dam, J.; Crawford, J. M.; Feld, M. S. (1998-01-19). "Observation of Periodic Fine Structure in Reflectance from Biological Tissue: A New Technique for Measuring Nuclear Size Distribution". Physical Review Letters. 80 (3): 627–630. Bibcode:1998PhRvL..80..627P. doi:10.1103/PhysRevLett.80.627.
- ^ Kumar, Manjit. Quantum: Einstein, Bohr, and the great debate about the nature of reality / Manjit Kumar.—1st American ed., 2008. Chap.1.
- ^ "Spectra and What They Can Tell Us", NASA https://imagine.gsfc.nasa.gov/science/toolbox/spectra1.html
- ^ BASIC SPECTROSCOPY, Santi Nonell1 and Cristiano Viappiani, http://photobiology.info/Nonell_Viappiani.html
- ^ Atomic Spectra Database, NIST, https://www.nist.gov/pml/atomic-spectra-database
- ^ Saul, Louise. (2020, April 06). The Different Types of Spectroscopy for Chemical Analysis. AZoOptics. Retrieved on November 10, 2021 from https://www.azooptics.com/Article.aspx?ArticleID=1382.
- ^ Isaac Asimov, Understanding Physics, Vol. 1, p.108.
- ^ "A Taste of ESPRESSO". Retrieved 15 September 2015.
- ^ Mariani, Z.; Strong, K.; Wolff, M.; Rowe, P.; Walden, V.; Fogal, P. F.; Duck, T.; Lesins, G.; Turner, D. S.; Cox, C.; Eloranta, E.; Drummond, J. R.; Roy, C.; Turner, D. D.; Hudak, D.; Lindenmaier, I. A. (2012). "Infrared measurements in the Arctic using two Atmospheric Emitted Radiance Interferometers". Atmospheric Measurement Techniques. 5 (2): 329–344. Bibcode:2012AMT.....5..329M. doi:10.5194/amt-5-329-2012.
- ^ Kroto, H. W. (1975). Molecular Rotation Spectra. Wiley. ISBN 9780471508533. OCLC 793428.
- ^ Bunker, Philip R.; Jensen, Per (1998). Molecular Symmetry and Spectroscopy. Ottawa: NRC Research Press. ISBN 9780660196282. OCLC 255512489.Volumes Publishing
- ^ Papoušek, Dušan; Aliev, Mamed Ragimovich (1982). Molecular Vibrational-rotational Spectra: Theory and Applications of High Resolution Infrared, Microwave, and Raman Spectroscopy of Polyatomic Molecules. Amsterdam: Elsevier Scientific Publishing Company. ISBN 9780444997371. OCLC 7278301.
- ^ Wilson, Edgar B.; Decius, John C.; Cross, Paul C. (1980-03-01). Molecular Vibrations: The Theory of Infrared and Raman Vibrational Spectra. Courier Corporation. ISBN 9780486639413. OCLC 1023249001.
- ^ Evans, C. L.; Xie, X. S. (2008). "Coherent Anti-Stokes Raman Scattering Microscopy: Chemical Imaging for Biology and Medicine". Annual Review of Analytical Chemistry. 1: 883–909. Bibcode:2008ARAC....1..883E. doi:10.1146/annurev.anchem.1.031207.112754. PMID 20636101.
- ^ W. Demtröder, Laser Spectroscopy, 3rd Ed. (Springer, 2003).
- ^ Brian Orr; J. G. Haub; Y. He; R. T. White (2016). "Spectroscopic Applications of Pulsed Tunable Optical Parametric Oscillators". In F. J. Duarte (ed.). Tunable Laser Applications (3rd ed.). Boca Raton: CRC Press. pp. 17–142. ISBN 978-1-4822-6106-6.
- ^ Backman, V.; Wallace, M. B.; Perelman, L. T.; Arendt, J. T.; Gurjar, R.; Müller, M. G.; Zhang, Q.; Zonios, G.; Kline, E.; McGillican, T.; Shapshay, S.; Valdez, T.; Badizadegan, K.; Crawford, J. M.; Fitzmaurice, M. (July 2000). "Detection of preinvasive cancer cells". Nature. 406 (6791): 35–36. doi:10.1038/35017638. ISSN 1476-4687. PMID 10894529. S2CID 4383575.
- ^ Murray, Kermit K.; Boyd, Robert K.; Eberlin, Marcos N.; Langley, G. John; Li, Liang; Naito, Yasuhide (2013). "Definitions of terms relating to mass spectrometry (IUPAC Recommendations 2013)". Pure and Applied Chemistry. 85 (7): 1. doi:10.1351/PAC-REC-06-04-06. ISSN 0033-4545.
- ^ N. A. Sinitsyn; Y. V. Pershin (2016). "The theory of spin noise spectroscopy: a review". Reports on Progress in Physics. 79 (10): 106501. arXiv:1603.06858. Bibcode:2016RPPh...79j6501S. doi:10.1088/0034-4885/79/10/106501. PMID 27615689. S2CID 4393400.
- ^ Solli, D. R.; Chou, J.; Jalali, B. (2008). "Amplified wavelength–time transformation for real-time spectroscopy". Nature Photonics. 2 (1): 48–51. Bibcode:2008NaPho...2...48S. doi:10.1038/nphoton.2007.253.
- ^ Chou, Jason; Solli, Daniel R.; Jalali, Bahram (2008). "Real-time spectroscopy with subgigahertz resolution using amplified dispersive Fourier transformation". Applied Physics Letters. 92 (11): 111102. arXiv:0803.1654. Bibcode:2008ApPhL..92k1102C. doi:10.1063/1.2896652. S2CID 53056467.
- ^ "Media advisory: Press Conference to Announce Major Result from Brazilian Astronomers". ESO Announcement. Retrieved 21 August 2013.
- ^ Brian Bowers (2001). Sir Charles Wheatstone FRS: 1802–1875 (2nd ed.). IET. pp. 207–208. ISBN 978-0-85296-103-2.
- ^ Brand, John C. D. (1995). Lines of Light: The Sources of Dispersive Spectroscopy, 1800 – 1930. Gordon and Breach Publishers. p. 57. ISBN 978-2884491624.
- ^ Wang, Xiping; Wacker, James P. (2006). "Using NIR Spectroscopy to Predict Weathered Wood Exposure Times" (PDF). WTCE 2006 – 9th World Conference on Timber Engineering. Archived from the original (PDF) on 2021-03-01. Retrieved 2009-06-22.
- ^ Sher, D. (1968). "The Relativistic Doppler Effect". Journal of the Royal Astronomical Society of Canada. 62: 105. Bibcode:1968JRASC..62..105S.
- ^ "Germany and France Will Stop Chick Culling". 22 July 2021.
- ^ Grau-Luque, Enric; Guc, Maxim; Becerril-Romero, Ignacio; Izquierdo-Roca, Víctor; Pérez-Rodríguez, Alejandro; Bolt, Pieter; Van den Bruele, Fieke; Ruhle, Ulfert (March 2022). "Thickness evaluation of AlO x barrier layers for encapsulation of flexible PV modules in industrial environments by normal reflectance and machine learning". Progress in Photovoltaics: Research and Applications. 30 (3): 229–239. doi:10.1002/pip.3478. ISSN 1062-7995.
- ^ a b c Andrew Fraknoi; David Morrison (October 13, 2016). "OpenStax Astronomy".
References edit
- John M. Chalmers; Peter Griffiths, eds. (2006). Handbook of Vibrational Spectroscopy. New York: Wiley. doi:10.1002/0470027320. ISBN 978-0-471-98847-2.
- Jerry Workman; Art Springsteen, eds. (1998). Applied Spectroscopy. Boston: Academic Press. ISBN 978-0-08-052749-9.
- Peter M. Skrabal (2012). Spectroscopy - An interdisciplinary integral description of spectroscopy from UV to NMR (e-book). ETH Zurich: vdf Hochschulverlag AG. doi:10.3218/3385-4. ISBN 978-3-7281-3385-4. S2CID 244026324.