


Summary
Statistical parametric mapping (SPM) is a statistical technique for examining differences in brain activity recorded during functional neuroimaging experiments. It was created by Karl Friston. It may alternatively refer to software created by the Wellcome Department of Imaging Neuroscience at University College London to carry out such analyses.
Approach edit
Unit of measurement edit
Functional neuroimaging is one type of 'brain scanning'. It involves the measurement of brain activity. The measurement technique depends on the imaging technology (e.g., fMRI and PET). The scanner produces a 'map' of the area that is represented as voxels. Each voxel represents the activity of a specific volume in three-dimensional space. The exact size of a voxel varies depending on the technology. fMRI voxels typically represent a volume of 27 mm3 in an equilateral cuboid.
Experimental design edit
Researchers examine brain activity linked to a specific mental process or processes. One approach involves asking 'which areas of the brain are significantly more active when doing task A compared to task B?'. Although the tasks might be designed to be identical, except for the behaviour under investigation, the brain is still likely to show changes in activity between tasks due to factors other than task differences (as the brain coordinates many parallel functions unrelated to the task). Further, the signal may contain noise from the imaging process itself.
To filter out these random effects, and to highlight the areas of activity linked specifically to the process under investigation, statistics look for the most significant differences. This involves a multi-stage process to prepare the data, and to analyse it using a general linear model.
Image pre-processing edit
Images from the scanner may be pre-processed to remove noise or correct for sampling errors.
A study usually scans a subject several times. To account for the motion of the head between scans, the images are typically adjusted so voxels in each image correspond (approximately) to the same site in the brain. This is referred to as realignment or motion correction, see image realignment.
Functional neuroimaging studies usually involve multiple participants, each of whom have differently shaped brains. All are likely to have the same gross anatomy, saving minor differences in overall brain size, individual variation in topography of the gyri and sulci of the cerebral cortex, and morphological differences in deep structures such as the corpus callosum. To aid comparisons, the 3D image of each brain is transformed so that superficial structures line up, via spatial normalization. Such normalization typically involves translation, rotation and scaling and nonlinear warping of the brain surface to match a standard template. Standard brain maps such as the Talairach-Tournoux or templates from the Montréal Neurological Institute (MNI) allow researchers from across the world to compare their results.
Images can be smoothed to make the data less noisy (similar to the 'blur' effect used in some image-editing software) by which voxels are averaged with their neighbours, typically using a Gaussian filter or by wavelet transformation.
Statistical comparison edit
Parametric statistical models are assumed at each voxel, using the general linear model to describe the data variability in terms of experimental and confounding effects, with residual variability. Hypotheses expressed in terms of the model parameters are assessed at each voxel with univariate statistics.
Analyses may examine differences over time (i.e. correlations between a task variable and brain activity in a certain area) using linear convolution models of how the measured signal is caused by underlying changes in neural activity.
Because many statistical tests are conducted, adjustments have to be made to control for type I errors (false positives) potentially caused by the comparison of levels of activity over many voxels. A type I error would result in falsely assessing background brain activity as related to the task. Adjustments are made based on the number of resels in the image and the theory of continuous random fields in order to set a new criterion for statistical significance that adjusts for the problem of multiple comparisons.
Graphical representations edit
Differences in measured brain activity can be represented in various ways.
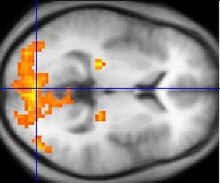
They can be presented as a table, displaying coordinates that show the most significant differences in activity between tasks. Alternatively, differences in brain activity can be shown as patches of colour on a brain 'slice', with the colours representing the location of voxels with statistically significant differences between conditions. The color gradient is mapped to statistical values, such as t-values or z-scores. This creates an intuitive and visually appealing map of the relative statistical strength of a given area.
Differences in activity can be represented as a 'glass brain', a representation of three outline views of the brain as if it were transparent. Only the patches of activation are visible as areas of shading. This is useful as a means of summarizing the total area of significant change in a given statistical comparison.
Software edit
SPM is software written by the Wellcome Department of Imaging Neuroscience at University College London to aid in the analysis of functional neuroimaging data. It is written using MATLAB and is distributed as free software.[1]
See also edit
References edit
- ^ "SPM - Statistical Parametric Mapping". www.fil.ion.ucl.ac.uk. Retrieved 2019-10-03.
External links edit
- Wikibooks SPM Wikibook.
- fMRI guide by Chris Rorden
- Introduction to fMRI: experimental design and data analysis
- Cambridge Imagers - Neuroimaging information and tutorials.
- Buttons in SPM5 PowerPoint presentation from the SPM for dummies course
- ISAS (Ictal-Interictal SPECT Analysis by SPM) - Yale University
- AutoSPM: Automated SPM for Surgical Planning