


Summary
Stokes shift is the difference (in energy, wavenumber or frequency units) between positions of the band maxima of the absorption and emission spectra (fluorescence and Raman being two examples) of the same electronic transition.[1] It is named after Irish physicist George Gabriel Stokes.[2][3][4]
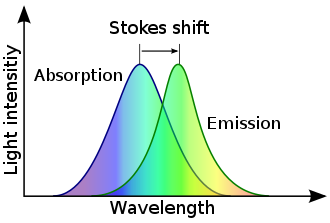

When a system (be it a molecule or atom) absorbs a photon, it gains energy and enters an excited state. The system can relax by emitting a photon. The Stokes shift occurs when the energy of the emitted photon is lower than that of the absorbed photon, representing the difference in energy of the two photons.
The Stokes shift is primarily the result of two phenomena: vibrational relaxation or dissipation and solvent reorganization. A fluorophore is a part of a molecule with a dipole moment that exhibits fluorescence. When a fluorophore enters an excited state, its dipole moment changes, but surrounding solvent molecules cannot adjust so quickly. Only after vibrational relaxation do their dipole moments realign.[5]
Stokes shifts are given in wavelength units, but this is less meaningful than energy, wavenumber or frequency units because it depends on the absorption wavelength. For instance, a 50 nm Stokes shift from absorption at 300 nm is larger in terms of energy than a 50 nm Stokes shift from absorption at 600 nm.
Stokes fluorescence edit

Stokes fluorescence is the emission of a longer-wavelength photon (lower frequency or energy) by a molecule that has absorbed a photon of shorter wavelength (higher frequency or energy).[6][7][8] Both absorption and radiation (emission) of energy are distinctive for a particular molecular structure. If a material has a direct bandgap in the range of visible light, the light shining on it is absorbed, which excites electrons to a higher-energy state. The electrons remain in the excited state for about 10−8 seconds. This number varies over several orders of magnitude, depending on the sample, and is known as the fluorescence lifetime of the sample. After losing a small amount of energy through vibrational relaxation, the molecule returns to the ground state, and energy is emitted.
Anti-Stokes shift edit
If the emitted photon has more energy than the absorbed photon, the energy difference is called an anti-Stokes shift;[9] this extra energy comes from dissipation of thermal phonons in a crystal lattice, cooling the crystal in the process.
Applications of Stokes and Anti-Stokes Shifts edit
Raman Spectroscopy edit
In Raman spectroscopy, when a molecule is excited by incident radiation, it undergoes a Stokes shift as it emits radiation at a lower energy level than the incident radiation. Analyzing the intensity and frequency of the spectral shift provides valuable information about the vibrational modes of molecules, enabling the identification of chemical bonds, functional groups, and molecular conformations.
Yttrium Oxysulfide edit
Yttrium oxysulfide doped with gadolinium oxysulfide is a common industrial anti-Stokes pigment, absorbing in the near-infrared and emitting in the visible region of the spectrum.[10] This composite material is often utilized in luminescent applications, where it absorbs lower-energy photons and emits higher-energy photons. This unique property makes it particularly valuable in various technological fields, including security printing, anti-counterfeiting measures, and luminescent displays. By harnessing anti-Stokes fluorescence, this pigment enables the creation of vibrant and durable inks, coatings, and materials with enhanced visibility and authentication capabilities.
Photon Upconversion edit
Photon upconversion is an anti-Stokes process where lower-energy photons are converted into higher-energy photons. An example of this later process is demonstrated by upconverting nanoparticles. It is more commonly observed in Raman spectroscopy, where it can be used to determine the temperature of a material.[11]
Optoelectronic Devices edit
In direct-bandgap thin-film semiconducting layers Stokes shifted emission can originate from three main sources: doping, strain, and disorder.[12] Each of these factors can introduce variations in the energy levels of the semiconductor material, leading to a shift in the emitted light towards longer wavelengths compared to the incident light. This phenomenon is particularly relevant in optoelectronic devices where controlling these factors can be crucial for optimizing device performance.
See also edit
References edit
- ^ Gispert, J. R. (2008). Coordination Chemistry. Wiley-VCH. p. 483. ISBN 978-3-527-31802-5.[permanent dead link]
- ^ Albani, J. R. (2004). Structure and Dynamics of Macromolecules: Absorption and Fluorescence Studies. Elsevier. p. 58. ISBN 0-444-51449-X.
- ^ Lakowicz, J. R. 1983. Principles of Fluorescence Spectroscopy, Plenum Press, New York. ISBN 0-387-31278-1.
- ^ Guilbault, G.G. 1990. Practical Fluorescence, Second Edition, Marcel Dekker, Inc., New York. ISBN 0-8247-8350-6.
- ^ "Fluorescence Microscopy - Basic Concepts in Fluorescence | Olympus LS". www.olympus-lifescience.com. Retrieved 2024-04-14.
- ^ Banwell C.N. and McCash E.M. Fundamentals of Molecular Spectroscopy (4th ed., McGraw-Hill 1994) p.101 and p.113 ISBN 0-07-707976-0
- ^ Atkins P. and de Paula J. Physical Chemistry (8th ed., W.H. Freeman 2006) p.431 ISBN 0-7167-8759-8
- ^ Rost, F. W. D. (1992). Fluorescence Microscopy. Cambridge University Press. p. 22. ISBN 0-521-23641-X. Archived from the original on November 13, 2012.
- ^ Kitai, A. (2008). Luminescent Materials and Applications. John Wiley and Sons. p. 32. ISBN 978-0-470-05818-3.
- ^ Georgobiani, A. N.; Bogatyreva, A. A.; Ishchenko, V. M.; Manashirov, O. Ya.; Gutan, V. B.; Semendyaev, S. V. (2007-10-01). "A new multifunctional phosphor based on yttrium oxysulfide". Inorganic Materials. 43 (10): 1073–1079. doi:10.1134/S0020168507100093. ISSN 1608-3172.
- ^ Keresztury, Gábor (2002). "Raman Spectroscopy: Theory". Handbook of Vibrational Spectroscopy. Vol. 1. Chichester: Wiley. ISBN 0471988472.
- ^ Pavel V. Kolesnichenko; Qianhui Zhang; Tinghe Yun; Changxi Zheng; Michael S. Fuhrer; Jeffrey A. Davis (2020). "Disentangling the effects of doping, strain and disorder in monolayer WS2 by optical spectroscopy". 2D Materials. 7 (2): 025008. arXiv:1909.08214. doi:10.1088/2053-1583/ab626a. S2CID 202661069.