


Summary
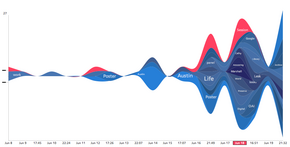
A streamgraph, or stream graph, is a type of stacked area graph which is displaced around a central axis, resulting in a flowing, organic shape. Unlike a traditional stacked area graph in which the layers are stacked on top of an axis, in a streamgraph the layers are positioned to minimize their "wiggle". More formally, the layers are displaced to minimize the sum of the squared slopes of each layer, weighted by the area of the layer.[1] Streamgraphs display data with only positive values, and are not able to represent both negative and positive values.[2]
Streamgraphs and their use were popularized by Amanda Cox in a February 2008 New York Times article on movie box office revenues.[3] Cox got the idea from then-undergraduate Lee Byron,[1] who had used a similar method for visualizing his music listening history.[4]

A related graph, sometimes conflated with streamgraphs, is the ThemeRiver, in which the "silhouette" of the graph is symmetrically arranged around the central axis.[1]
Streamgraphs were found to be more readable than basic stacked area graphs or ThemeRivers for value comparison tasks.[5]
Streamgraphs are officially supported by Matplotlib[6] and D3.js.[7]
Marco Di Bartolomeo and Yifan Hu (2016) propose several improvements to streamgraphs, such as using 1-norm minimization instead of 2-norm minimization.[2]
References edit
- ^ a b c Byron, Lee; Wattenberg, Martin (November–December 2008). "Stacked Graphs – Geometry & Aesthetics". IEEE Transactions on Visualization and Computer Graphics. 14 (6). IEEE Computer Society: 1245–1252. doi:10.1109/TVCG.2008.166. ISSN 1077-2626. PMID 18988970. S2CID 15281429.
- ^ a b Bartolomeo, Marco Di; Hu, Yifan (2016). "There is More to Streamgraphs than Movies: Better Aesthetics via Ordering and Lassoing". Computer Graphics Forum. 35 (3): 341–350. doi:10.1111/cgf.12910. ISSN 1467-8659. S2CID 17724977.
- ^ Matthew Bloch; Lee Byron; Shan Carter; Amanda Cox (23 February 2008). "The Ebb and Flow of Movies: Box Office Receipts 1986–2007". The New York Times. Retrieved 24 July 2012.
- ^ "Talk to the Newsroom: Graphics Director Steve Duenes". The New York Times. 2008-02-25. ISSN 0362-4331. Retrieved 2021-04-24.
- ^ Thudt, Alice; Walny, Jagoda; Perin, Charles; Rajabiyazdi, Fateme; MacDonald, Lindsay; Vardeleon, Riane; Greenberg, Saul; Carpendale, Sheelagh (June 2016). "Assessing the Readability of Stacked Graphs". Proceedings of the 42nd Graphics Interface Conference. GI '16. Victoria, British Columbia, Canada: Canadian Human-Computer Communications Society: 167–174. ISBN 978-0-9947868-1-4.
- ^ "matplotlib.axes.Axes.stackplot — Matplotlib 3.1.2 documentation". matplotlib.org. Retrieved 2020-10-06.
- ^ "d3/d3-shape". GitHub. Retrieved 2020-10-06.
External links edit
- Lee Byron's streamgraph_generator
- RAWGraphs Open-source visualization tool easing streamgraph generation.
- StreamGraph Open-source javascript for generating a streamgraph in SVG.