


Summary
Surface tension is the tendency of liquid surfaces at rest to shrink into the minimum surface area possible. Surface tension is what allows objects with a higher density than water such as razor blades and insects (e.g. water striders) to float on a water surface without becoming even partly submerged.

At liquid–air interfaces, surface tension results from the greater attraction of liquid molecules to each other (due to cohesion) than to the molecules in the air (due to adhesion).[1]
There are two primary mechanisms in play. One is an inward force on the surface molecules causing the liquid to contract.[2][3] Second is a tangential force parallel to the surface of the liquid.[3] This tangential force is generally referred to as the surface tension. The net effect is the liquid behaves as if its surface were covered with a stretched elastic membrane. But this analogy must not be taken too far as the tension in an elastic membrane is dependent on the amount of deformation of the membrane while surface tension is an inherent property of the liquid–air or liquid–vapour interface.[4]
Because of the relatively high attraction of water molecules to each other through a web of hydrogen bonds, water has a higher surface tension (72.8 millinewtons (mN) per meter at 20 °C) than most other liquids. Surface tension is an important factor in the phenomenon of capillarity.
Surface tension has the dimension of force per unit length, or of energy per unit area.[4] The two are equivalent, but when referring to energy per unit of area, it is common to use the term surface energy, which is a more general term in the sense that it applies also to solids.
In materials science, surface tension is used for either surface stress or surface energy.
Causes edit

Due to the cohesive forces, a molecule located away from the surface is pulled equally in every direction by neighboring liquid molecules, resulting in a net force of zero. The molecules at the surface do not have the same molecules on all sides of them and therefore are pulled inward. This creates some internal pressure and forces liquid surfaces to contract to the minimum area.[2]
There is also a tension parallel to the surface at the liquid-air interface which will resist an external force, due to the cohesive nature of water molecules.[2][3]
The forces of attraction acting between molecules of the same type are called cohesive forces, while those acting between molecules of different types are called adhesive forces. The balance between the cohesion of the liquid and its adhesion to the material of the container determines the degree of wetting, the contact angle, and the shape of meniscus. When cohesion dominates (specifically, adhesion energy is less than half of cohesion energy) the wetting is low and the meniscus is convex at a vertical wall (as for mercury in a glass container). On the other hand, when adhesion dominates (when adhesion energy is more than half of cohesion energy) the wetting is high and the similar meniscus is concave (as in water in a glass).
Surface tension is responsible for the shape of liquid droplets. Although easily deformed, droplets of water tend to be pulled into a spherical shape by the imbalance in cohesive forces of the surface layer. In the absence of other forces, drops of virtually all liquids would be approximately spherical. The spherical shape minimizes the necessary "wall tension" of the surface layer according to Laplace's law.
Another way to view surface tension is in terms of energy. A molecule in contact with a neighbor is in a lower state of energy than if it were alone. The interior molecules have as many neighbors as they can possibly have, but the boundary molecules are missing neighbors (compared to interior molecules) and therefore have higher energy. For the liquid to minimize its energy state, the number of higher energy boundary molecules must be minimized. The minimized number of boundary molecules results in a minimal surface area.[5] As a result of surface area minimization, a surface will assume a smooth shape.
Physics edit
Physical units edit
Surface tension, represented by the symbol γ (alternatively σ or T), is measured in force per unit length. Its SI unit is newton per meter but the cgs unit of dyne per centimeter is also used. For example,[6]

Definition edit

Surface tension can be defined in terms of force or energy.
In terms of force edit
Surface tension γ of a liquid is the force per unit length. In the illustration on the right, the rectangular frame, composed of three unmovable sides (black) that form a "U" shape, and a fourth movable side (blue) that can slide to the right. Surface tension will pull the blue bar to the left; the force F required to hold the movable side is proportional to the length L of the immobile side. Thus the ratio F/L depends only on the intrinsic properties of the liquid (composition, temperature, etc.), not on its geometry. For example, if the frame had a more complicated shape, the ratio F/L, with L the length of the movable side and F the force required to stop it from sliding, is found to be the same for all shapes. We therefore define the surface tension as

In terms of energy edit
Surface tension γ of a liquid is the ratio of the change in the energy of the liquid to the change in the surface area of the liquid (that led to the change in energy). This can be easily related to the previous definition in terms of force:[7] if F is the force required to stop the side from starting to slide, then this is also the force that would keep the side in the state of sliding at a constant speed (by Newton's Second Law). But if the side is moving to the right (in the direction the force is applied), then the surface area of the stretched liquid is increasing while the applied force is doing work on the liquid. This means that increasing the surface area increases the energy of the film. The work done by the force F in moving the side by distance Δx is W = FΔx; at the same time the total area of the film increases by ΔA = 2LΔx (the factor of 2 is here because the liquid has two sides, two surfaces). Thus, multiplying both the numerator and the denominator of γ = 1/2F/L by Δx, we get

Effects edit
Water edit
Several effects of surface tension can be seen with ordinary water:
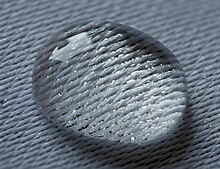
- Beading of rain water on a waxy surface, such as a leaf. Water adheres weakly to wax and strongly to itself, so water clusters into drops. Surface tension gives them their near-spherical shape, because a sphere has the smallest possible surface area to volume ratio.
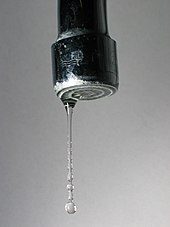
- Formation of drops occurs when a mass of liquid is stretched. The animation (below) shows water adhering to the faucet gaining mass until it is stretched to a point where the surface tension can no longer keep the drop linked to the faucet. It then separates and surface tension forms the drop into a sphere. If a stream of water were running from the faucet, the stream would break up into drops during its fall. Gravity stretches the stream, then surface tension pinches it into spheres.[9]
- Flotation of objects denser than water occurs when the object is nonwettable and its weight is small enough to be borne by the forces arising from surface tension.[5] For example, water striders use surface tension to walk on the surface of a pond in the following way. The nonwettability of the water strider's leg means there is no attraction between molecules of the leg and molecules of the water, so when the leg pushes down on the water, the surface tension of the water only tries to recover its flatness from its deformation due to the leg. This behavior of the water pushes the water strider upward so it can stand on the surface of the water as long as its mass is small enough that the water can support it. The surface of the water behaves like an elastic film: the insect's feet cause indentations in the water's surface, increasing its surface area[10] and tendency of minimization of surface curvature (so area) of the water pushes the insect's feet upward.
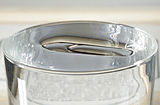
- Separation of oil and water (in this case, water and liquid wax) is caused by a tension in the surface between dissimilar liquids. This type of surface tension is called "interface tension", but its chemistry is the same.
- Tears of wine is the formation of drops and rivulets on the side of a glass containing an alcoholic beverage. Its cause is a complex interaction between the differing surface tensions of water and ethanol; it is induced by a combination of surface tension modification of water by ethanol together with ethanol evaporating faster than water.
-
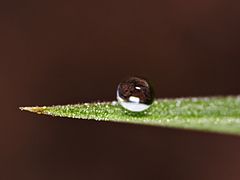 A. Water beading on a leaf
 -
 B. Water dripping from a tap
 -
 C. Water striders stay at the top of liquid because of surface tension
 -
 D. Lava lamp with interaction between dissimilar liquids: water and liquid wax
 -
 E. Photo showing the "tears of wine" phenomenon.


Surfactants edit
Surface tension is visible in other common phenomena, especially when surfactants are used to decrease it:
- Soap bubbles have very large surface areas with very little mass. Bubbles in pure water are unstable. The addition of surfactants, however, can have a stabilizing effect on the bubbles (see Marangoni effect). Surfactants actually reduce the surface tension of water by a factor of three or more.
- Emulsions are a type of colloidal dispersion in which surface tension plays a role. Tiny droplets of oil dispersed in pure water will spontaneously coalesce and phase separate. The addition of surfactants reduces the interfacial tension and allow for the formation of oil droplets in the water medium (or vice versa). The stability of such formed oil droplets depends on many different chemical and environmental factors.
Surface curvature and pressure edit

If no force acts normal to a tensioned surface, the surface must remain flat. But if the pressure on one side of the surface differs from pressure on the other side, the pressure difference times surface area results in a normal force. In order for the surface tension forces to cancel the force due to pressure, the surface must be curved. The diagram shows how surface curvature of a tiny patch of surface leads to a net component of surface tension forces acting normal to the center of the patch. When all the forces are balanced, the resulting equation is known as the Young–Laplace equation:[11]

- Δp is the pressure difference, known as the Laplace pressure.[12]
- γ is surface tension.
- Rx and Ry are radii of curvature in each of the axes that are parallel to the surface.
The quantity in parentheses on the right hand side is in fact (twice) the mean curvature of the surface (depending on normalisation). Solutions to this equation determine the shape of water drops, puddles, menisci, soap bubbles, and all other shapes determined by surface tension (such as the shape of the impressions that a water strider's feet make on the surface of a pond). The table below shows how the internal pressure of a water droplet increases with decreasing radius. For not very small drops the effect is subtle, but the pressure difference becomes enormous when the drop sizes approach the molecular size. (In the limit of a single molecule the concept becomes meaningless.)
| Droplet radius | 1 mm | 0.1 mm | 1 μm | 10 nm |
|---|---|---|---|---|
| Δp (atm) | 0.0014 | 0.0144 | 1.436 | 143.6 |
Floating objects edit
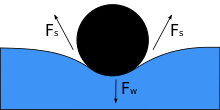
When an object is placed on a liquid, its weight Fw depresses the surface, and if surface tension and downward force become equal then it is balanced by the surface tension forces on either side Fs, which are each parallel to the water's surface at the points where it contacts the object. Notice that small movement in the body may cause the object to sink. As the angle of contact decreases, surface tension decreases. The horizontal components of the two Fs arrows point in opposite directions, so they cancel each other, but the vertical components point in the same direction and therefore add up[5] to balance Fw. The object's surface must not be wettable for this to happen, and its weight must be low enough for the surface tension to support it. If m denotes the mass of the needle and g acceleration due to gravity, we have

Liquid surface edit

To find the shape of the minimal surface bounded by some arbitrary shaped frame using strictly mathematical means can be a daunting task. Yet by fashioning the frame out of wire and dipping it in soap-solution, a locally minimal surface will appear in the resulting soap-film within seconds.[8][13]
The reason for this is that the pressure difference across a fluid interface is proportional to the mean curvature, as seen in the Young–Laplace equation. For an open soap film, the pressure difference is zero, hence the mean curvature is zero, and minimal surfaces have the property of zero mean curvature.
Contact angles edit
The surface of any liquid is an interface between that liquid and some other medium.[note 1] The top surface of a pond, for example, is an interface between the pond water and the air. Surface tension, then, is not a property of the liquid alone, but a property of the liquid's interface with another medium. If a liquid is in a container, then besides the liquid/air interface at its top surface, there is also an interface between the liquid and the walls of the container. The surface tension between the liquid and air is usually different (greater) than its surface tension with the walls of a container. And where the two surfaces meet, their geometry must be such that all forces balance.[8][11]
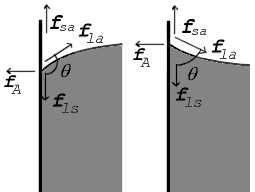 |
Where the two surfaces meet, they form a contact angle, θ, which is the angle the tangent to the surface makes with the solid surface. Note that the angle is measured through the liquid, as shown in the diagrams above. The diagram to the right shows two examples. Tension forces are shown for the liquid–air interface, the liquid–solid interface, and the solid–air interface. The example on the left is where the difference between the liquid–solid and solid–air surface tension, γls − γsa, is less than the liquid–air surface tension, γla, but is nevertheless positive, that is

In the diagram, both the vertical and horizontal forces must cancel exactly at the contact point, known as equilibrium. The horizontal component of fla is canceled by the adhesive force, fA.[8]

The more telling balance of forces, though, is in the vertical direction. The vertical component of fla must exactly cancel the difference of the forces along the solid surface, fls − fsa.[8]

| Liquid | Solid | Contact angle | |||
|---|---|---|---|---|---|
| water |
|
0° | |||
| ethanol | |||||
| diethyl ether | |||||
| carbon tetrachloride | |||||
| glycerol | |||||
| acetic acid | |||||
| water | paraffin wax | 107° | |||
| silver | 90° | ||||
| methyl iodide | soda-lime glass | 29° | |||
| lead glass | 30° | ||||
| fused quartz | 33° | ||||
| mercury | soda-lime glass | 140° |
Since the forces are in direct proportion to their respective surface tensions, we also have:[11]

where
- γls is the liquid–solid surface tension,
- γla is the liquid–air surface tension,
- γsa is the solid–air surface tension,
- θ is the contact angle, where a concave meniscus has contact angle less than 90° and a convex meniscus has contact angle of greater than 90°.[8]
This means that although the difference between the liquid–solid and solid–air surface tension, γls − γsa, is difficult to measure directly, it can be inferred from the liquid–air surface tension, γla, and the equilibrium contact angle, θ, which is a function of the easily measurable advancing and receding contact angles (see main article contact angle).
This same relationship exists in the diagram on the right. But in this case we see that because the contact angle is less than 90°, the liquid–solid/solid–air surface tension difference must be negative:

Special contact angles edit
Observe that in the special case of a water–silver interface where the contact angle is equal to 90°, the liquid–solid/solid–air surface tension difference is exactly zero.
Another special case is where the contact angle is exactly 180°. Water with specially prepared Teflon approaches this.[11] Contact angle of 180° occurs when the liquid–solid surface tension is exactly equal to the liquid–air surface tension.

Liquid in a vertical tube edit

An old style mercury barometer consists of a vertical glass tube about 1 cm in diameter partially filled with mercury, and with a vacuum (called Torricelli's vacuum) in the unfilled volume (see diagram to the right). Notice that the mercury level at the center of the tube is higher than at the edges, making the upper surface of the mercury dome-shaped. The center of mass of the entire column of mercury would be slightly lower if the top surface of the mercury were flat over the entire cross-section of the tube. But the dome-shaped top gives slightly less surface area to the entire mass of mercury. Again the two effects combine to minimize the total potential energy. Such a surface shape is known as a convex meniscus.
We consider the surface area of the entire mass of mercury, including the part of the surface that is in contact with the glass, because mercury does not adhere to glass at all. So the surface tension of the mercury acts over its entire surface area, including where it is in contact with the glass. If instead of glass, the tube was made out of copper, the situation would be very different. Mercury aggressively adheres to copper. So in a copper tube, the level of mercury at the center of the tube will be lower than at the edges (that is, it would be a concave meniscus). In a situation where the liquid adheres to the walls of its container, we consider the part of the fluid's surface area that is in contact with the container to have negative surface tension. The fluid then works to maximize the contact surface area. So in this case increasing the area in contact with the container decreases rather than increases the potential energy. That decrease is enough to compensate for the increased potential energy associated with lifting the fluid near the walls of the container.

If a tube is sufficiently narrow and the liquid adhesion to its walls is sufficiently strong, surface tension can draw liquid up the tube in a phenomenon known as capillary action. The height to which the column is lifted is given by Jurin's law:[8]

where
- h is the height the liquid is lifted,
- γla is the liquid–air surface tension,
- ρ is the density of the liquid,
- r is the radius of the capillary,
- g is the acceleration due to gravity,
- θ is the angle of contact described above. If θ is greater than 90°, as with mercury in a glass container, the liquid will be depressed rather than lifted.
Puddles on a surface edit


Pouring mercury onto a horizontal flat sheet of glass results in a puddle that has a perceptible thickness. The puddle will spread out only to the point where it is a little under half a centimetre thick, and no thinner. Again this is due to the action of mercury's strong surface tension. The liquid mass flattens out because that brings as much of the mercury to as low a level as possible, but the surface tension, at the same time, is acting to reduce the total surface area. The result of the compromise is a puddle of a nearly fixed thickness.
The same surface tension demonstration can be done with water, lime water or even saline, but only on a surface made of a substance to which water does not adhere. Wax is such a substance. Water poured onto a smooth, flat, horizontal wax surface, say a waxed sheet of glass, will behave similarly to the mercury poured onto glass.
The thickness of a puddle of liquid on a surface whose contact angle is 180° is given by:[11]

where
- h is the depth of the puddle in centimeters or meters.
- γ is the surface tension of the liquid in dynes per centimeter or newtons per meter.
- g is the acceleration due to gravity and is equal to 980 cm/s2 or 9.8 m/s2
- ρ is the density of the liquid in grams per cubic centimeter or kilograms per cubic meter

In reality, the thicknesses of the puddles will be slightly less than what is predicted by the above formula because very few surfaces have a contact angle of 180° with any liquid. When the contact angle is less than 180°, the thickness is given by:[11]

For mercury on glass, γHg = 487 dyn/cm, ρHg = 13.5 g/cm3 and θ = 140°, which gives hHg = 0.36 cm. For water on paraffin at 25 °C, γ = 72 dyn/cm, ρ = 1.0 g/cm3, and θ = 107° which gives hH2O = 0.44 cm.
The formula also predicts that when the contact angle is 0°, the liquid will spread out into a micro-thin layer over the surface. Such a surface is said to be fully wettable by the liquid.
The breakup of streams into drops edit
In day-to-day life all of us observe that a stream of water emerging from a faucet will break up into droplets, no matter how smoothly the stream is emitted from the faucet. This is due to a phenomenon called the Plateau–Rayleigh instability,[11] which is entirely a consequence of the effects of surface tension.
The explanation of this instability begins with the existence of tiny perturbations in the stream. These are always present, no matter how smooth the stream is. If the perturbations are resolved into sinusoidal components, we find that some components grow with time while others decay with time. Among those that grow with time, some grow at faster rates than others. Whether a component decays or grows, and how fast it grows is entirely a function of its wave number (a measure of how many peaks and troughs per centimeter) and the radii of the original cylindrical stream.
Gallery edit
-
 Breakup of a moving sheet of water bouncing off of a spoon.
 -
 Photo of flowing water adhering to a hand. Surface tension creates the sheet of water between the flow and the hand.
 -

-
 Surface tension prevents a coin from sinking: the coin is indisputably denser than water, so it must be displacing a volume greater than its own for buoyancy to balance mass.
 -
 An aluminium coin floats on the surface of the water at 10 °C. Any extra weight would drop the coin to the bottom.
 -
 A daisy. The entirety of the flower lies below the level of the (undisturbed) free surface. The water rises smoothly around its edge. Surface tension prevents water from displacing the air between the petals and possibly submerging the flower.
 -
 A metal paper clip floats on water. Several can usually be carefully added without overflow of water.
 -
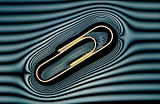 A metal paperclip floating on water. A grille in front of the light has created the 'contour lines' which show the deformation in the water surface caused by the metal paper clip.


Thermodynamics edit
Thermodynamic theories of surface tension edit
J.W. Gibbs developed the thermodynamic theory of capillarity based on the idea of surfaces of discontinuity.[14] Gibbs considered the case of a sharp mathematical surface being placed somewhere within the microscopically fuzzy physical interface that exists between two homogeneous substances. Realizing that the exact choice of the surface's location was somewhat arbitrary, he left it flexible. Since the interface exists in thermal and chemical equilibrium with the substances around it (having temperature T and chemical potentials μi), Gibbs considered the case where the surface may have excess energy, excess entropy, and excess particles, finding the natural free energy function in this case to be , a quantity later named as the grand potential and given the symbol .


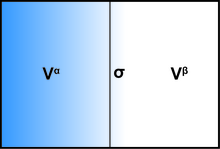
Considering a given subvolume containing a surface of discontinuity, the volume is divided by the mathematical surface into two parts A and B, with volumes and , with exactly. Now, if the two parts A and B were homogeneous fluids (with pressures , ) and remained perfectly homogeneous right up to the mathematical boundary, without any surface effects, the total grand potential of this volume would be simply . The surface effects of interest are a modification to this, and they can be all collected into a surface free energy term so the total grand potential of the volume becomes:


For sufficiently macroscopic and gently curved surfaces, the surface free energy must simply be proportional to the surface area:[14][15]


As stated above, this implies the mechanical work needed to increase a surface area A is dW = γ dA, assuming the volumes on each side do not change. Thermodynamics requires that for systems held at constant chemical potential and temperature, all spontaneous changes of state are accompanied by a decrease in this free energy , that is, an increase in total entropy taking into account the possible movement of energy and particles from the surface into the surrounding fluids. From this it is easy to understand why decreasing the surface area of a mass of liquid is always spontaneous, provided it is not coupled to any other energy changes. It follows that in order to increase surface area, a certain amount of energy must be added.
Gibbs and other scientists have wrestled with the arbitrariness in the exact microscopic placement of the surface.[16] For microscopic surfaces with very tight curvatures, it is not correct to assume the surface tension is independent of size, and topics like the Tolman length come into play. For a macroscopic-sized surface (and planar surfaces), the surface placement does not have a significant effect on γ; however, it does have a very strong effect on the values of the surface entropy, surface excess mass densities, and surface internal energy,[14]: 237 which are the partial derivatives of the surface tension function .

Gibbs emphasized that for solids, the surface free energy may be completely different from surface stress (what he called surface tension):[14]: 315 the surface free energy is the work required to form the surface, while surface stress is the work required to stretch the surface. In the case of a two-fluid interface, there is no distinction between forming and stretching because the fluids and the surface completely replenish their nature when the surface is stretched. For a solid, stretching the surface, even elastically, results in a fundamentally changed surface. Further, the surface stress on a solid is a directional quantity (a stress tensor) while surface energy is scalar.
Fifteen years after Gibbs, J.D. van der Waals developed the theory of capillarity effects based on the hypothesis of a continuous variation of density.[17] He added to the energy density the term where c is the capillarity coefficient and ρ is the density. For the multiphase equilibria, the results of the van der Waals approach practically coincide with the Gibbs formulae, but for modelling of the dynamics of phase transitions the van der Waals approach is much more convenient.[18][19] The van der Waals capillarity energy is now widely used in the phase field models of multiphase flows. Such terms are also discovered in the dynamics of non-equilibrium gases.[20]

Thermodynamics of bubbles edit
The pressure inside an ideal spherical bubble can be derived from thermodynamic free energy considerations.[15] The above free energy can be written as:


For a spherical bubble, the volume and surface area are given simply by


Substituting these relations into the previous expression, we find

Influence of temperature edit

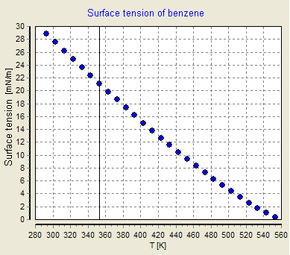
Surface tension is dependent on temperature. For that reason, when a value is given for the surface tension of an interface, temperature must be explicitly stated. The general trend is that surface tension decreases with the increase of temperature, reaching a value of 0 at the critical temperature. For further details see Eötvös rule. There are only empirical equations to relate surface tension and temperature:
- Eötvös:[21][22][23] Here V is the molar volume of a substance, TC is the critical temperature and k is a constant valid for almost all substances.[21] A typical value is k = 2.1×10⁻⁷ J K−1 mol−2⁄3.[21][23] For water one can further use V = 18 ml/mol and TC = 647 K (374 °C).[24] A variant on Eötvös is described by Ramay and Shields:[25]where the temperature offset of 6 K provides the formula with a better fit to reality at lower temperatures.
- Guggenheim–Katayama:[22] γ° is a constant for each liquid and n is an empirical factor, whose value is 11/9 for organic liquids. This equation was also proposed by van der Waals, who further proposed that γ° could be given by the expressionwhere K2 is a universal constant for all liquids, and PC is the critical pressure of the liquid (although later experiments found K2 to vary to some degree from one liquid to another).[22]


Both Guggenheim–Katayama and Eötvös take into account the fact that surface tension reaches 0 at the critical temperature, whereas Ramay and Shields fails to match reality at this endpoint.
Influence of solute concentration edit
Solutes can have different effects on surface tension depending on the nature of the surface and the solute:
- Little or no effect, for example sugar at water|air, most organic compounds at oil/air
- Increase surface tension, most inorganic salts at water|air
- Non-monotonic change, most inorganic acids at water|air
- Decrease surface tension progressively, as with most amphiphiles, e.g., alcohols at water|air
- Decrease surface tension until certain critical concentration, and no effect afterwards: surfactants that form micelles
What complicates the effect is that a solute can exist in a different concentration at the surface of a solvent than in its bulk. This difference varies from one solute–solvent combination to another.
Gibbs isotherm states that:

- Γ is known as surface concentration, it represents excess of solute per unit area of the surface over what would be present if the bulk concentration prevailed all the way to the surface. It has units of mol/m2
- C is the concentration of the substance in the bulk solution.
- R is the gas constant and T the temperature
Certain assumptions are taken in its deduction, therefore Gibbs isotherm can only be applied to ideal (very dilute) solutions with two components.
Influence of particle size on vapor pressure edit
The Clausius–Clapeyron relation leads to another equation also attributed to Kelvin, as the Kelvin equation. It explains why, because of surface tension, the vapor pressure for small droplets of liquid in suspension is greater than standard vapor pressure of that same liquid when the interface is flat. That is to say that when a liquid is forming small droplets, the equilibrium concentration of its vapor in its surroundings is greater. This arises because the pressure inside the droplet is greater than outside.[25]


- Pv° is the standard vapor pressure for that liquid at that temperature and pressure.
- V is the molar volume.
- R is the gas constant
- rk is the Kelvin radius, the radius of the droplets.
The effect explains supersaturation of vapors. In the absence of nucleation sites, tiny droplets must form before they can evolve into larger droplets. This requires a vapor pressure many times the vapor pressure at the phase transition point.[25]
This equation is also used in catalyst chemistry to assess mesoporosity for solids.[26]
The effect can be viewed in terms of the average number of molecular neighbors of surface molecules (see diagram).
The table shows some calculated values of this effect for water at different drop sizes:
| P/P0 for water drops of different radii at STP[22] | ||||
|---|---|---|---|---|
| Droplet radius (nm) | 1000 | 100 | 10 | 1 |
| P/P0 | 1.001 | 1.011 | 1.114 | 2.95 |
The effect becomes clear for very small drop sizes, as a drop of 1 nm radius has about 100 molecules inside, which is a quantity small enough to require a quantum mechanics analysis.
Methods of measurement edit
Because surface tension manifests itself in various effects, it offers a number of paths to its measurement. Which method is optimal depends upon the nature of the liquid being measured, the conditions under which its tension is to be measured, and the stability of its surface when it is deformed. An instrument that measures surface tension is called tensiometer.
- Du Noüy ring method: The traditional method used to measure surface or interfacial tension. Wetting properties of the surface or interface have little influence on this measuring technique. Maximum pull exerted on the ring by the surface is measured.[21]
- Wilhelmy plate method: A universal method especially suited to check surface tension over long time intervals. A vertical plate of known perimeter is attached to a balance, and the force due to wetting is measured.
- Spinning drop method: This technique is ideal for measuring low interfacial tensions. The diameter of a drop within a heavy phase is measured while both are rotated.
- Pendant drop method: Surface and interfacial tension can be measured by this technique, even at elevated temperatures and pressures. Geometry of a drop is analyzed optically. For pendant drops the maximum diameter and the ratio between this parameter and the diameter at the distance of the maximum diameter from the drop apex has been used to evaluate the size and shape parameters in order to determine surface tension.
- Bubble pressure method (Jaeger's method): A measurement technique for determining surface tension at short surface ages. Maximum pressure of each bubble is measured.
- Drop volume method: A method for determining interfacial tension as a function of interface age. Liquid of one density is pumped into a second liquid of a different density and time between drops produced is measured.
- Capillary rise method: The end of a capillary is immersed into the solution. The height at which the solution reaches inside the capillary is related to the surface tension by the equation discussed above.[27]
- Stalagmometric method: A method of weighting and reading a drop of liquid.
- Sessile drop method: A method for determining surface tension and density by placing a drop on a substrate and measuring the contact angle (see Sessile drop technique).[28]
- Du Noüy–Padday method: A minimized version of Du Noüy method uses a small diameter metal needle instead of a ring, in combination with a high sensitivity microbalance to record maximum pull. The advantage of this method is that very small sample volumes (down to few tens of microliters) can be measured with very high precision, without the need to correct for buoyancy (for a needle or rather, rod, with proper geometry). Further, the measurement can be performed very quickly, minimally in about 20 seconds.
- Vibrational frequency of levitated drops: The natural frequency of vibrational oscillations of magnetically levitated drops has been used to measure the surface tension of superfluid 4He. This value is estimated to be 0.375 dyn/cm at T = 0 K.[29]
- Resonant oscillations of spherical and hemispherical liquid drop: The technique is based on measuring the resonant frequency of spherical and hemispherical pendant droplets driven in oscillations by a modulated electric field. The surface tension and viscosity can be evaluated from the obtained resonant curves.[30][31][32]
- Drop-bounce method: This method is based on aerodynamic levitation with a split-able nozzle design. After dropping a stably levitated droplet onto a platform, the sample deforms and bounces back, oscillating in mid-air as it tries to minimize its surface area. Through this oscillation behavior, the liquid's surface tension and viscosity can be measured.[33]
Values edit
Data table edit
| Liquid | Temperature (°C) | Surface tension, γ |
|---|---|---|
| Acetic acid | 20 | 27.60 |
| Acetic acid (45.1%) + Water | 30 | 40.68 |
| Acetic acid (10.0%) + Water | 30 | 54.56 |
| Acetone | 20 | 23.70 |
| Blood | 22 | 55.89 |
| Diethyl ether | 20 | 17.00 |
| Ethanol | 20 | 22.27 |
| Ethanol (40%) + Water | 25 | 29.63 |
| Ethanol (11.1%) + Water | 25 | 46.03 |
| Glycerol | 20 | 63.00 |
| n-Hexane | 20 | 18.40 |
| Hydrochloric acid 17.7 M aqueous solution | 20 | 65.95 |
| Isopropanol | 20 | 21.70 |
| Liquid helium II | −273 | 0.37[35] |
| Liquid nitrogen | −196 | 8.85 |
| Liquid oxygen | −182 | 13.2 |
| Mercury | 15 | 487.00 |
| Methanol | 20 | 22.60 |
| Molten Silver chloride | 650 | 163[36] |
| Molten Sodium chloride/Calcium chloride (47/53 mole %) | 650 | 139[37] |
| n-Octane | 20 | 21.80 |
| Sodium chloride 6.0 M aqueous solution | 20 | 82.55 |
| Sucrose (55%) + water | 20 | 76.45 |
| Water | 0 | 75.64 |
| Water | 25 | 71.97 |
| Water | 50 | 67.91 |
| Water | 100 | 58.85 |
| Toluene | 25 | 27.73 |
Surface tension of water edit
The surface tension of pure liquid water in contact with its vapor has been given by IAPWS[38] as
![{\displaystyle \gamma _{\text{w}}=235.8\left(1-{\frac {T}{T_{\text{C}}}}\right)^{1.256}\left[1-0.625\left(1-{\frac {T}{T_{\text{C}}}}\right)\right]~{\text{mN/m}},}](https://wikimedia.org/api/rest_v1/media/math/render/svg/0b65193820b2a29652f19d30a1adecdf0c13c8ea)
where both T and the critical temperature TC = 647.096 K are expressed in kelvins. The region of validity the entire vapor–liquid saturation curve, from the triple point (0.01 °C) to the critical point. It also provides reasonable results when extrapolated to metastable (supercooled) conditions, down to at least −25 °C. This formulation was originally adopted by IAPWS in 1976 and was adjusted in 1994 to conform to the International Temperature Scale of 1990.
The uncertainty of this formulation is given over the full range of temperature by IAPWS.[38] For temperatures below 100 °C, the uncertainty is ±0.5%.
Surface tension of seawater edit
Nayar et al.[39] published reference data for the surface tension of seawater over the salinity range of 20 ≤ S ≤ 131 g/kg and a temperature range of 1 ≤ t ≤ 92 °C at atmospheric pressure. The range of temperature and salinity encompasses both the oceanographic range and the range of conditions encountered in thermal desalination technologies. The uncertainty of the measurements varied from 0.18 to 0.37 mN/m with the average uncertainty being 0.22 mN/m.
Nayar et al. correlated the data with the following equation

The International Association for the Properties of Water and Steam (IAPWS) has adopted this correlation as an international standard guideline.[41]
See also edit
- Anti-fog
- Capillary wave—short waves on a water surface, governed by surface tension and inertia
- Cheerio effect—the tendency for small wettable floating objects to attract one another.
- Cohesion
- Dimensionless numbers
- Dortmund Data Bank—contains experimental temperature-dependent surface tensions
- Electrodipping force
- Electrowetting
- Electrocapillarity
- Eötvös rule—a rule for predicting surface tension dependent on temperature
- Fluid pipe
- Hydrostatic equilibrium—the effect of gravity pulling matter into a round shape
- Interface (chemistry)
- Meniscus—surface curvature formed by a liquid in a container
- Mercury beating heart—a consequence of inhomogeneous surface tension
- Microfluidics
- Sessile drop technique
- Sow-Hsin Chen
- Specific surface energy—same as surface tension in isotropic materials.
- Spinning drop method
- Stalagmometric method
- Surface pressure
- Surface science
- Surface tension biomimetics
- Surface tension values
- Surfactants—substances which reduce surface tension.
- Szyszkowski equation—calculating surface tension of aqueous solutions
- Tears of wine—the surface tension induced phenomenon seen on the sides of glasses containing alcoholic beverages.
- Tolman length—leading term in correcting the surface tension for curved surfaces.
- Wetting and dewetting
Explanatory notes edit
- ^ In a mercury barometer, the upper liquid surface is an interface between the liquid and a vacuum containing some molecules of evaporated liquid.
References edit
- ^ "Surface Tension - an overview | ScienceDirect Topics". www.sciencedirect.com. Archived from the original on 2021-12-30. Retrieved 2021-12-30.
- ^ a b c "Surface Tension (Water Properties) – USGS Water Science School". US Geological Survey. July 2015. Archived from the original on October 7, 2015. Retrieved November 6, 2015.
- ^ a b c Berry, M V (1971). "The molecular mechanism of surface tension" (PDF). Physics Education. 6 (2): 79–84. Bibcode:1971PhyEd...6...79B. doi:10.1088/0031-9120/6/2/001. S2CID 250797804. Archived (PDF) from the original on 31 December 2021. Retrieved 8 July 2020.
- ^ a b Halliday, David; Resnick, Robert; Krane, Kenneth S. (2010-04-20). Physics, Volume 2. John Wiley & Sons. p. 342. ISBN 978-0-471-40194-0. Archived from the original on 2022-09-22. Retrieved 2021-03-19.
- ^ a b c White, Harvey E. (1948). Modern College Physics. van Nostrand. ISBN 978-0-442-29401-4.
- ^ Bush, John W. M. (April 2004). "MIT Lecture Notes on Surface Tension, lecture 1" (PDF). Massachusetts Institute of Technology. Archived (PDF) from the original on March 8, 2022. Retrieved April 1, 2007.
- ^ "Mechanical definition of surface tension". MIT. Archived from the original on April 12, 2013. Retrieved Dec 16, 2013.
- ^ a b c d e f g h Sears, Francis Weston; Zemanski, Mark W. (1955) University Physics 2nd ed. Addison Wesley
- ^ Bush, John W. M. (May 2004). "MIT Lecture Notes on Surface Tension, lecture 5" (PDF). Massachusetts Institute of Technology. Archived (PDF) from the original on February 26, 2007. Retrieved April 1, 2007.
- ^ Bush, John W. M. (May 2004). "MIT Lecture Notes on Surface Tension, lecture 3" (PDF). Massachusetts Institute of Technology. Archived (PDF) from the original on February 26, 2007. Retrieved April 1, 2007.
- ^ a b c d e f g h Pierre-Gilles de Gennes; Françoise Brochard-Wyart; David Quéré (2002). Capillarity and Wetting Phenomena—Drops, Bubbles, Pearls, Waves. Alex Reisinger. Springer. ISBN 978-0-387-00592-8.
- ^ Butt, Hans-Jürgen; Graf, Karlheinz; Kappl, Michael (2006). Physics and Chemistry of Interfaces. Wiley. p. 9. ISBN 978-3-527-60640-5.
- ^ Aaronson, Scott (March 2005) NP-complete Problems and Physical Reality Archived 2018-02-23 at the Wayback Machine. ACM SIGACT News
- ^ a b c d Gibbs, J.W. (2002) [1876–1878], "On the Equilibrium of Heterogeneous Substances", in Bumstead, H.A.; Van Nameeds, R.G. (eds.), The Scientific Papers of J. Willard Gibbs, vol. 1, Woodbridge, CT: Ox Bow Press, pp. 55–354, ISBN 978-0918024770
- ^ a b Landau; Lifshitz (1980). Course of Theoretical Physics Volume 5: Statistical Physics I (3 ed.). Pergamon. pp. 517–537.
- ^ Rusanov, A (2005). "Surface thermodynamics revisited". Surface Science Reports. 58 (5–8): 111–239. Bibcode:2005SurSR..58..111R. doi:10.1016/j.surfrep.2005.08.002. ISSN 0167-5729.
- ^ van der Waals, J.D. (1979) [1893], "The thermodynamic theory of capillarity under the hypothesis of a continuous variation of density", J. Stat. Phys., 20 (2), translated by Rowlinson, J.S.: 197–200, Bibcode:1979JSP....20..197R, doi:10.1007/BF01011513, S2CID 122954999
- ^ Cahn, J.W.; Hilliard, J.E. (1958), "Free energy of a nonuniform system. I. Interfacial free energy", J. Chem. Phys., 28 (2): 258–266, Bibcode:1958JChPh..28..258C, doi:10.1063/1.1744102
- ^ Langer, J.S.; Bar-On, M.; Miller, H.D. (1975), "New computational method in the theory of spinodal decomposition", Phys. Rev. A, 11 (4): 1417–1429, Bibcode:1975PhRvA..11.1417L, doi:10.1103/PhysRevA.11.1417
- ^ Gorban, A.N.; Karlin, I. V. (2016), "Beyond Navier–Stokes equations: capillarity of ideal gas", Contemporary Physics (Review article), 58 (1): 70–90, arXiv:1702.00831, Bibcode:2017ConPh..58...70G, doi:10.1080/00107514.2016.1256123, S2CID 55317543
- ^ a b c d "Surface Tension by the Ring Method (Du Nouy Method)" (PDF). PHYWE. Archived (PDF) from the original on 2007-09-27. Retrieved 2007-09-08.
- ^ a b c d Adam, Neil Kensington (1941). The Physics and Chemistry of Surfaces, 3rd ed. Oxford University Press.
- ^ a b "Physical Properties Sources Index: Eötvös Constant". Archived from the original on 2011-07-06. Retrieved 2008-11-16.
- ^ Vargaftik, N. B.; Volkov, B. N.; Voljak, L. D. (1983). "International Tables of the Surface Tension of Water" (PDF). Journal of Physical and Chemical Reference Data. 12 (3): 817. Bibcode:1983JPCRD..12..817V. doi:10.1063/1.555688. Archived from the original (PDF) on 2016-12-21. Retrieved 2017-07-13.
- ^ a b c Moore, Walter J. (1962). Physical Chemistry, 3rd ed. Prentice Hall.
- ^ Ertl, G.; Knözinger, H. and Weitkamp, J. (1997). Handbook of heterogeneous catalysis, Vol. 2, p. 430. Wiley-VCH, Weinheim. ISBN 3-527-31241-2
- ^ Calvert, James B. "Surface Tension (physics lecture notes)". University of Denver. Archived from the original on 2007-09-15. Retrieved 2007-09-08.
- ^ "Sessile Drop Method". Dataphysics. Archived from the original on August 8, 2007. Retrieved 2007-09-08.
- ^ Vicente, C.; Yao, W.; Maris, H.; Seidel, G. (2002). "Surface tension of liquid 4He as measured using the vibration modes of a levitated drop". Physical Review B. 66 (21): 214504. Bibcode:2002PhRvB..66u4504V. doi:10.1103/PhysRevB.66.214504.
- ^ Zografov, Nikolay (2014). "Droplet oscillations driven by an electric field". Colloids and Surfaces A: Physicochemical and Engineering Aspects. 460: 351–354. doi:10.1016/j.colsurfa.2013.12.013.
- ^ Tankovsky, N. (2013). "Electrically Driven Resonant Oscillations of Pendant Hemispherical Liquid Droplet and Possibility to Evaluate the Surface Tension in Real Time". Zeitschrift für Physikalische Chemie. 227 (12): 1759–1766. doi:10.1524/zpch.2013.0420. S2CID 101722165.
- ^ Tankovsky, Nikolay (2011). "Oscillations of a Hanging Liquid Drop, Driven by Interfacial Dielectric Force". Zeitschrift für Physikalische Chemie. 225 (4): 405–411. doi:10.1524/zpch.2011.0074. S2CID 101625925.
- ^ Sun, Yifan; Muta, Hiroaki; Ohishi, Yuji (June 2021). "Novel Method for Surface Tension Measurement: the Drop-Bounce Method". Microgravity Science and Technology. 33 (3): 32. Bibcode:2021MicST..33...32S. doi:10.1007/s12217-021-09883-7.
- ^ Lange's Handbook of Chemistry (1967) 10th ed. pp 1661–1665 ISBN 0-07-016190-9 (11th ed.)
- ^ Brouwer, W; Pathria, R. K (1967). "On the Surface Tension of Liquid Helium II". Physical Review. 163 (1): 200–205. Bibcode:1967PhRv..163..200B. doi:10.1103/PhysRev.163.200.
- ^ Moser, Z; Gasior, W; Rzyman, K (1982). "Activities and Surface Tension of Liquid AgCl-KCl Solutions". Journal of the Electrochemical Society. 129 (3): 502–506. doi:10.1149/1.2131529.
- ^ Addison, C; Coldrey, J (1960). "Influence of Surface Reactions on the Interface Between Liquid Sodium and Molten Sodium Chloride + Calcium Chloride Mixtures". Transactions of the Faraday Society. 56: 840–845. doi:10.1039/tf9605600840.
- ^ a b International Association for the Properties of Water and Steam (June 2014). "Revised Release on Surface Tension of Ordinary Water Substance". Archived from the original on 2016-04-04. Retrieved 2016-02-20.
- ^ Nayar, K. G; Panchanathan, D; McKinley, G. H; Lienhard, J. H (November 2014). "Surface tension of seawater" (PDF). J. Phys. Chem. Ref. Data. 43 (4): 43103. Bibcode:2014JPCRD..43d3103N. doi:10.1063/1.4899037. hdl:1721.1/96884. Archived from the original on 2022-09-22. Retrieved 2018-04-20.
- ^ Millero, Frank J; Feistel, Rainer; Wright, Daniel G; McDougall, Trevor J (January 2008). "The composition of Standard Seawater and the definition of the Reference-Composition Salinity Scale". Deep-Sea Research Part I. 55 (1): 50. Bibcode:2008DSRI...55...50M. doi:10.1016/j.dsr.2007.10.001.
- ^ Guideline on the Surface Tension of Seawater (PDF) (Technical report). International Association for the Properties of Water and Steam. October 2019. IAPWS G14-19. Archived (PDF) from the original on 2020-03-26. Retrieved 2020-03-26.
External links edit
- "Why is surface tension parallel to the interface?". Physics Stack Exchange. Retrieved 2021-03-19.
- Berry, M V (1971-03-01). "The molecular mechanism of surface tension". Physics Education. 6 (2): 79–84. doi:10.1088/0031-9120/6/2/001. ISSN 0031-9120.
- Marchand, Antonin; Weijs, Joost H.; Snoeijer, Jacco H.; Andreotti, Bruno (2011-09-26). "Why is surface tension a force parallel to the interface?". American Journal of Physics. 79 (10): 999–1008. doi:10.1119/1.3619866. ISSN 0002-9505. arXiv: https://arxiv.org/abs/1211.3854
- On surface tension and interesting real-world cases
- Surface Tensions of Various Liquids
- Calculation of temperature-dependent surface tensions for some common components
- Surface tension calculator for aqueous solutions containing the ions H+, NH+
4, Na+, K+, Mg2+, Ca2+, SO2−
4, NO−
3, Cl−, CO2−
3, Br− and OH−. - T. Proctor Hall (1893) New methods of measuring surface tension in liquids, Philosophical Magazine (series 5, 36: 385–415), link from Biodiversity Heritage Library.
- The Bubble Wall[permanent dead link] (Audio slideshow from the National High Magnetic Field Laboratory explaining cohesion, surface tension and hydrogen bonds)
- C. Pfister: Interface Free Energy. Scholarpedia 2010 (from first principles of statistical mechanics)
- Surface and Interfacial Tension
- "Molten salts mixture surface tension". The Journal of Chemical Thermodynamics. 3 (2): 259–265. March 1971. doi:10.1016/S0021-9614(71)80111-8.