


Summary
A survivorship curve is a graph showing the number or proportion of individuals surviving to each age for a given species or group (e.g. males or females). Survivorship curves can be constructed for a given cohort (a group of individuals of roughly the same age) based on a life table.
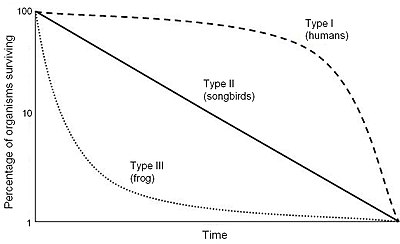
There are three generalized types of survivorship curves:[1]
- Type I or convex curves are characterized by high age-specific survival probability in early and middle life, followed by a rapid decline in survival in later life. They are typical of species that produce few offspring but care for them well, including humans and many other large mammals such as elephants. These are also known as K-selected species (see: r/K selection theory)
- Type II or diagonal curves are an intermediate between Types I and III, where roughly constant mortality rate/survival probability is experienced regardless of age. Some birds and some lizards follow this pattern.
- Type III or concave curves have the greatest mortality (lowest age-specific survival) early in life, with relatively low rates of death (high probability of survival) for those surviving this bottleneck. This type of curve is characteristic of species that produce a large number of offspring (known as r-selected species). This includes most marine invertebrates. For example, oysters produce millions of eggs, but most larvae die from predation or other causes; those that survive long enough to produce a hard shell live relatively long.
The number or proportion of organisms surviving to any age is plotted on the y-axis (generally with a logarithmic scale starting with 1000 individuals), while their age (often as a proportion of maximum life span) is plotted on the x-axis.
In mathematical statistics, the survival function is one specific form of survivorship curve and plays a basic part in survival analysis.
There are various reasons that a species exhibits their particular survivorship curve, but one contributor can be environmental factors that decrease survival. For example, an outside element that is nondiscriminatory in the ages that it affects (of a particular species) is likely to yield a Type II survivorship curve, in which the young and old are equally likely to be affected. On the other hand, an outside element that preferentially reduces the survival of young individuals is likely to yield a Type III curve. Finally, if an outside element only reduces the survival of organisms later in life, this is likely to yield a Type I curve.[2]
See also edit
References edit
- ^ B., Reece, Jane (2011-01-01). Campbell biology. Pearson Australia. ISBN 9781442531765. OCLC 712136178.
{{cite book}}: CS1 maint: multiple names: authors list (link) - ^ Demetrius, Lloyd (1978-09-21). "Adaptive value, entropy and survivorship curves". Nature. 275 (5677): 213–214. Bibcode:1978Natur.275..213D. doi:10.1038/275213a0. PMID 692692. S2CID 4212265.