


Summary
The Tempestry Project is a collaborative fiber arts project that presents global warming data in visual form through knitted or crocheted artwork. The project is part of a larger "data art" movement and the developing field of climate change art, which seeks to exploit the human tendency to value personal experience over data by creating accessible experiential representations of the data.
 Tempestries for Utqiagvik, Alaska (L—R: 1925, 2010, 2016) and Death Valley, California (L—R: 1950, 2016) | |
| Formation | 2017 |
|---|---|
| Website | www |
Tempestries are made by knitting or crocheting rows in specified colors that represent respective high temperatures each day for a year. Multiple works are typically displayed together to show change over time. The project began in 2017 in Anacortes, Washington, US, and has since spread throughout the country and around the world.
The word "tempestry" is a portmanteau of "temperature" and "tapestry."
History edit
The first tempestry was created using 2016 data from the Naval Air Station on Whidbey Island, Washington.[1] Emily McNeil, Marissa Connelly, and Justin Connelly, having read about climatologists trying to preserve climate research data in preparation for anticipated removal of such data from US government websites by the Trump administration, were "joking" that "we should return to more concrete forms of data storage."[1]
In January 2017 McNeil,[2] Marissa Connelly[3] and Justin Connelly founded the project in Anacortes, Washington[4] to encourage other fiber artists to produce "striking visuals that communicate changes at an intimate, local scale."[5] According to Justin Connelly, "The science articles talk about what's happening at the poles. For many people, that's not their experience and so they don't relate to it in a powerful way...but even here [outside Seattle], in a temperate place, you can see stark change over the last 40 years or so. It puts it in their backyard."[5] The project name is a portmanteau of the words "temperature" and "tapestry."[5]
The organization offers kits including yarn, instructions, and a data sheet of daily temperatures in a given location. In 2017 they sold 40 kits and in 2018, 500.[1] The 2018–19 United States federal government shutdown temporarily affected production for the US, as the National Oceanic and Atmospheric Administration (NOAA) restricted access to the databases used to provide historical weather data for the United States.[6]
The concept was inspired by a similar fiberwork concept called a "temperature blanket", an afghan- or bedspread-sized project commemorating a particular year by working stripes or bands of colors representing each day's high or low temperature for a year.[5][7][8]
As of December 2018 projects had been created by fiber artists in nearly every U.S. state and in 20 other countries.[2]
Production edit

Each tempestry is knitted or crocheted, one row each day,[9] in the specified color for each date's high temperature[3] starting on January 1 and ending on December 31 for a given year in a single location to form a banner the size of a scarf[3][10] that graphically represents a year of daily high temperatures in a single location.[2][11][12]
Colors for each five-degree temperature range are standardized and temperature data is collected from the NOAA[13] so that collected displays of work by different artists working in different locations and on different years can be interpreted as direct comparisons.[5]
Because gauge is different between crochet vs. knitting, for different knit stitches, and among different crafters, finished tempestries will vary in length and width depending on whether they're created by the same crafter using the same stitch or are created by different crafters using a variety of stitches. Some crafters' gauge varies, and two works created even by a crafter with a very stable gauge using the same stitch will inevitably vary slightly.[14]
Display edit

Tempestry banners are typically hung vertically, the first row (representing January 1) at the bottom and the final row (December 31) at the top, in groupings of two or more to show how daily high temperatures have changed year-to-year in a given location.[2][12]
Project pieces were first publicly displayed in Anacortes, Washington.[2] In 2018 projects were displayed at the Museum of Northwest Art[15] and at the Creative Climate Awards in New York City.[5][16] In May 2019 a project consisting of 27 tempestries representing 100 years on Orcas Island in 4-year increments was displayed at the Pacific Northwest Quilt and Fiberarts Museum.[17]
In 2020 pieces were displayed at the San Juan Islands Museum of Art[18] and at Temple University's Ginsberg Health Sciences Library.[19]
Projects edit
In 2019 a group of US knitters organized a National Park Tempestry Project, inviting crafters to create a tempestry for 2016 – the year of the National Park Service Centennial – and one for the earliest year for which data was available for each US National Park.[6][18]
In 2019 the Schuylkill Center for Environmental Education near Philadelphia organized a project using data provided by the Franklin Institute to create tempestries for the city, one for every fifth year from 1875 through 2018.[1] Crafters in Mexico City organized a similar project.[1]
Similar artworks edit
According to data journalist David McCandless, tempestries and similar creations are part of a larger data art movement in which data is represented in novel ways.[20] Grace Ebert, writing for Colossal, calls such projects "part of a larger movement to document micro weather changes that may serve as indicators of broader climate issues."[21][22] Electronic literature writer and scholar, Anastasia Salter, uses Tempestry scarves to illustrate the fusion of craft and computation in procedural electronic literature. [23]
Works inspired by The Tempestry Project edit
Faculty at North Central Michigan College produced a similar exhibit in 2018 inspired by The Tempestry Project.[24][25] Pennsylvania State University professor Laura Guertin contributed a poster to the American Geophysical Union's 2017 Fall meeting displaying similar works for January through April 1917, 1967, and 2017.[26]
Some fiber artists have created banners similar to tempestries, but using daily low temperatures.[3]
Other climate change art edit
Other artists and scientists are experimenting with climate change art as a way to overcome humans' hardwired tendency to value personal experience over data and to disengage from data-based representations[27] by making the data "vivid and accessible".[28][21] In 2018, artist Xavier Cortada's project Underwater Home Owner's Association placed signs in front yards throughout Miami, Florida indicating each property's height above sea level to illustrate what sea level rise would flood that property.[27][29]
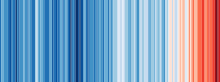
In 2016, Ed Hawkins, a climate scientist at the National Centre for Atmospheric Science and the University of Reading, created "Climate Spirals," a series of data art representations of climate change, and followed in 2018 with "warming stripes," a series of color stripes representing chronologically ordered average annual temperature anomalies for a given location.[27][31]
In 2015, University of Georgia marine scientist Joan Sheldon produced a scarf illustrating average yearly temperature from the 1600s to the present using one row per year.[32]
In 2012, filmmaker Jeff Orlowski made Chasing Ice, documenting photographer James Balog's Extreme Ice Survey, which uses time-lapse photography to show the disappearance of glaciers over time.[28]
In 2007, artist Eve Mosher used a sports-field chalk marker to draw a blue "high-water" line around Manhattan and Brooklyn, showing the areas that would be underwater if climate change predictions are realized. Her HighWaterLine Project has since drawn high-water lines around Bristol, Philadelphia, and two coastal cities in Florida.[28]
Other fiber data art edit
In 2005, the Knitting Map, a European Capital of Culture project in Cork, Ireland, recorded the city's daily temperatures and citizen walking patterns to create a "fiber representation of the city."[6]
Sarah-Marie Belcastro uses knitting to explore mathematics, such as knitting a "non-orientable surface of genus 5".[33] Pat Ashforth and Steve Plummer call these types of data artists "mathekniticians".[34]
See also edit
References edit
- ^ a b c d e Miller, Zoe. "Activist crafters at Philly's new 'Tempestry' knitting group are sounding the alarm on global warming". Philadelphia Inquirer. Archived from the original on 7 May 2019. Retrieved 12 May 2019.
- ^ a b c d e Hansen, Ariel (2018-11-09). "What's a 'tempestry'? Knitters turn temperature data into art". Yale Climate Connections. Retrieved 7 January 2019.
- ^ a b c d Nandi, Jayashree. "A Knitting Movement of Weather Data to Document Climate Change". Hindustan Times. Archived from the original on 6 January 2019. Retrieved 7 January 2019.
- ^ "Asheville Tempestry Project". Art + Science In The Field. 12 December 2018. Archived from the original on 2 February 2019. Retrieved 7 January 2019.
- ^ a b c d e f Chaisson, Clara. "Trump Is Trying to Pull the Wool Over Our Eyes About Climate Change—These Knitters Aren't Having It". National Resources Defense Council. Archived from the original on 20 December 2018. Retrieved 7 January 2019.
- ^ a b c Zambello, Erika. "Crafters Work To Create The National Park Tempestry Project". National Parks Traveler. Retrieved 12 May 2019.
- ^ Eckert, Liza (9 August 2016). "What is a temperature blanket?". Lion Brand. Archived from the original on 2 February 2019. Retrieved 7 January 2019.
- ^ D'Sa, Premila (2020-02-13). "Well, Here's A Clever And Cosy Way To Track Climate Change". HuffPost Canada. Retrieved 2020-02-21.
- ^ Zak, Dan. "'Everything is not going to be okay': How to live with constant reminders that the Earth is in trouble". Washington Post. Archived from the original on 2 February 2019. Retrieved 25 January 2019.
- ^ "Frequently Asked Questions". The Tempestry Project. Retrieved 7 January 2019.
- ^ Stone, Maddie. "Meet the Knitters Who Are Turning Climate Change Data Into a Fashion Statement". Gizmodo. Archived from the original on 28 December 2018. Retrieved 11 January 2019.
- ^ a b "About". The Tempestry Project. Retrieved 7 January 2019.
- ^ "What's Going On in This Graph?". New York Times. Archived from the original on 6 March 2019. Retrieved 4 March 2019.
- ^ Smith, Mary. "Understanding knitting gauge". Earth Guild. Retrieved 12 May 2019.
- ^ Hunter, Stephen. "A marriage of art and nature". Cascadia Weekly. Retrieved 14 January 2019.
- ^ "The Tempestry Project". Human Impacts Institute. Archived from the original on 28 February 2019. Retrieved 7 January 2019.
- ^ "Island artists' textile work on display in La Conner". Island Sounder. Retrieved 16 May 2019.
- ^ a b "Tempestry Project In the San Juans and at SJIMA". sanjuanislander.com. Retrieved 2020-01-14.
- ^ Kerr, Natalie (2020-02-18). "Art exhibit shows global warming stitch by stitch". The Temple News. Retrieved 2020-02-19.
- ^ Hutton, Rachel (20 February 2019). "Twin Cities crafters reflect climate change with 'temperature' blankets and scarves". Minneapolis Star-Tribune. Archived from the original on 6 March 2019. Retrieved 4 March 2019.
- ^ a b Ebert, Grace (2020-02-11). "People Are Knitting, Crocheting, and Weaving Tangible Records of Temperature Changes". Colossal. Retrieved 2020-02-21.
- ^ Daher, Nadine. "How Knitting Enthusiasts Are Using Their Craft to Visualize Climate Change". Smithsonian Magazine. Retrieved 2020-02-21.
- ^ Salter, Anastasia (3 May 2020). "Electronic Book Review". doi:10.7273/dped-gd56.
{{cite journal}}: Cite journal requires|journal=(help) - ^ Miller, Sean. "Climate change reflected in college fiber art installation". Petoskey News. Archived from the original on 26 September 2018. Retrieved 7 January 2019.
- ^ "Tempestry Project open house Oct. 5". Harbor Light News. Archived from the original on 28 February 2019. Retrieved 7 January 2019.
- ^ Guertin, Laura (2017). "Utilizing Crochet to Showcase Temporal Patterns in Temperature Records from One Location and to Spark a Climate Conversation". AGU Fall Meeting Abstracts. 2017: PA43A–0315. Bibcode:2017AGUFMPA43A0315G. Retrieved 11 January 2019.
- ^ a b c Brookshire, Bethany. "Using art to show the threat of climate change: These seven artists are using climate change concepts in their work". Science News for Students. Retrieved 20 May 2019.
- ^ a b c "Art Makes Environmental Change Real: Experiencing the science of climate change rather than learning about it". Scientific American. Retrieved 20 May 2019.
- ^ Lescaze, Zoe. "12 Artists On: Climate Change: A dozen artistic responses to one of the greatest threats of our time". New York Times. Retrieved 20 May 2019.
- ^ Hawkins, Ed (4 December 2018). "2018 visualisation update / Warming stripes for 1850-2018 using the WMO annual global temperature dataset". Climate Lab Book. Archived from the original on 17 April 2019. (Direct link to image)
- ^ "Ed Hawkins' warming stripes add colour to climate communication - National Centre for Atmospheric Science". National Centre for Atmospheric Science. Retrieved 2019-05-18.
- ^ Schwab, Katharine (11 January 2019). "Crafting takes a dark turn in the age of climate crisis". Fast Company. Archived from the original on 11 January 2019. Retrieved 11 January 2019.
- ^ Ward, Mark (2012-08-20). "Knitting with maths and metal". Retrieved 2019-05-20.
- ^ "About Us". www.woollythoughts.com. Retrieved 2019-05-20.
External links edit
- Official website
- The Tempestry Project on Facebook
- The Tempestry Project on Ravelry