


Summary
The 2019 Atlantic hurricane season was an event in the annual tropical cyclone season in the north Atlantic Ocean. It was the fourth consecutive above-normal Atlantic hurricane season.[a][2] The season officially began on June 1, 2019 and ended on November 30, 2019. These dates, adopted by convention, historically describe the period in each year when most tropical systems form.[3] However, storm formation is possible at any time of the year, as demonstrated in 2019 by the formation of the season's first named storm, Subtropical Storm Andrea, on May 20. The final storm of the season, Tropical Storm Sebastien, transitioned to an extratropical cyclone on November 25.
| Timeline of the 2019 Atlantic hurricane season | |||||
|---|---|---|---|---|---|
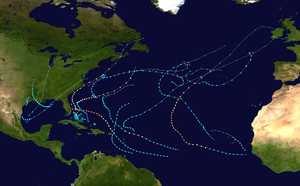 Season summary map | |||||
| Season boundaries | |||||
| First system formed | May 20, 2019 | ||||
| Last system dissipated | November 25, 2019 | ||||
| Strongest system | |||||
| Name | Dorian | ||||
| Maximum winds | 185 mph (295 km/h) (1-minute sustained) | ||||
| Lowest pressure | 910 mbar (hPa; 26.87 inHg) | ||||
| Longest lasting system | |||||
| Name | Dorian | ||||
| Duration | 14.25 days | ||||
| |||||
The National Oceanic and Atmospheric Administration's 2019 seasonal outlook called for 10–17 named storms, including 5–9 hurricanes and 2–4 major hurricanes. Altogether, the season produced 18 named storms, including six hurricanes of which three intensified into major hurricanes.[b][2] Two major hurricanes, Dorian and Lorenzo, became Category 5 storms, causing the season to become the fourth consecutive with at least one Category 5 hurricane. Dorian inflicted catastrophic damage across the Bahamas. The hurricane killed at least 70 people and caused at least US$3.4 billion in damage, making it the costliest hurricane in the country's history. While Lorenzo did not affect land as a Category 5 hurricane, it caused US$367 million in damage and killed 19, with over half of the deaths being attributed to the sinking of a tugboat known as the Bourbon Rhode.[5][6][7] In March 2021, the name Dorian was retired from reuse in the North Atlantic by the World Meteorological Organization.[8]
This timeline documents tropical cyclone formations, strengthening, weakening, landfalls, extratropical transitions, and dissipations during the season. It includes information that was not released throughout the season, meaning that data from post-storm reviews by the National Hurricane Center, such as a storm that was not initially warned upon, has been included.
By convention, meteorologists use one time zone when issuing forecasts and making observations: Coordinated Universal Time (UTC), and also use the 24-hour clock (where 00:00 = midnight UTC).[9] The National Hurricane Center uses both UTC and the time zone where the center of the tropical cyclone is currently located. The time zones utilized (east to west) prior to 2020 were: Atlantic, Eastern, and Central.[10] In this timeline, all information is listed by UTC first with the respective regional time included in parentheses. Additionally, figures for maximum sustained winds and position estimates are rounded to the nearest 5 units (knots, miles, or kilometers), following the convention used in the National Hurricane Center's products. Direct wind observations are rounded to the nearest whole number. Atmospheric pressures are listed to the nearest millibar and nearest hundredth of an inch of mercury.
Timeline edit

May edit
May 20
- 18:00 UTC (2:00 p.m. AST) at 28°06′N 68°36′W / 28.1°N 68.6°W – Subtropical Storm Andrea forms from a broad area of low pressure about 370 mi (595 km) southwest of Bermuda.[11]
May 21
- 00:00 UTC (8:00 p.m. AST, May 20) at 29°06′N 68°48′W / 29.1°N 68.8°W – Subtropical Storm Andrea reaches peak intensity with maximum sustained winds of 40 mph (65 km/h) and a minimum barometric pressure of 1,006 mbar (29.71 inHg), about 320 mi (520 km) southwest of Bermuda.[11]
- 12:00 UTC (8:00 a.m. AST) at 30°36′N 69°06′W / 30.6°N 69.1°W – Subtropical Storm Andrea degenerates into a remnant low, and is later absorbed by a cold front about 70 mi (110 km) southwest of Bermuda.[11]
June edit
June 1
- The 2019 Atlantic hurricane season officially begins.[3]
July edit
July 11
- 00:00 UTC (7:00 p.m. CDT, May 10) at 27°48′N 87°36′W / 27.8°N 87.6°W – A tropical depression forms from an elongated low over the far northeastern Gulf of Mexico, about 195 mi (315 km) south of Mobile, Alabama.[c][12]
- 06:00 UTC (1:00 a.m. CDT) at 27°42′N 88°00′W / 27.7°N 88.0°W – The tropical depression in the northeastern Gulf of Mexico strengthens into Tropical Storm Barry, about 195 mi (315 km) south of Mobile.[12]
July 12
- 18:00 UTC (1:00 p.m. CDT) at 28°24′N 90°42′W / 28.4°N 90.7°W – Tropical Storm Barry reaches its minimum pressure of 993 mbar (29.32 inHg), south of the southcentral Louisiana coast.[12]

July 13
- 12:00 UTC (7:00 a.m. CDT) at 29°18′N 91°54′W / 29.3°N 91.9°W – Tropical Storm Barry strengthens to a Category 1 hurricane, and simultaneously attains its peak sustained wind speed of 75 mph (120 km/h), south of the southcentral Louisiana coast.[12]
- 15:00 UTC (10:00 a.m. CDT) at 29°36′N 92°12′W / 29.6°N 92.2°W – Hurricane Barry makes landfall about 10 mi (20 km) east-southeast of Pecan Island, Louisiana.[12]
- 18:00 UTC (1:00 p.m. CDT) at 29°54′N 92°24′W / 29.9°N 92.4°W – Hurricane Barry weakens to a tropical storm inland, about 15 mi (20 km) east-southeast of Intracoastal City, Louisiana.[12]
July 15
- 00:00 UTC (7:00 p.m. CDT, July 14) at 33°00′N 93°36′W / 33.0°N 93.6°W – Tropical Storm Barry weakens into a tropical depression about 235 mi (380 km) northwest of Intracoastal City.
- 12:00 UTC (7:00 a.m. CDT) at 34°42′N 93°36′W / 34.7°N 93.6°W – Tropical Storm Barry becomes a remnant low while over western Arkansas, and subsequently dissipates over southern Missouri.[12]
July 22
- 12:00 UTC (8:00 a.m. EDT) at 24°36′N 77°24′W / 24.6°N 77.4°W – Tropical Depression Three forms from a tropical wave about 40 mi (65 km) east of Andros Island in the Bahamas.[13]
July 23
- 06:00 UTC (2:00 a.m. EDT) at 26°54′N 79°36′W / 26.9°N 79.6°W – Tropical Depression Three reaches peak intensity with maximum sustained winds of 35 mph (55 km/h) and a minimum pressure of 1,013 mbar (29.91 inHg), 120 mi (195 km) south-southeast of Cape Canaveral, Florida.[13]
- 12:00 UTC (8:00 a.m. EDT) at 28°36′N 80°00′W / 28.6°N 80.0°W – Tropical Depression Three degenerates into a remnant low about 35 mi (55 km) east-northeast of Cape Canaveral, Florida, and dissipates shortly thereafter.[13]
August edit
August 20
- 18:00 UTC (2:00 p.m. AST) at 40°06′N 59°42′W / 40.1°N 59.7°W – Tropical Depression Four develops from an area of low pressure about 370 mi (590 km) southeast of Halifax, Nova Scotia.[14]
August 21
- 00:00 UTC (8:00 p.m. AST, August 20) at 40°18′N 57°06′W / 40.3°N 57.1°W – Tropical Depression Four becomes Tropical Storm Chantal, and simultaneously reaches its peak intensity with maximum sustained winds of 40 mph (65 km/h) and a minimum pressure of 1,007 mbar (29.74 inHg).[14]
August 22
- 00:00 UTC (8:00 p.m. AST, August 21) at 39°36′N 48°18′W / 39.6°N 48.3°W – Tropical Storm Chantal weakens to a tropical depression about 547 mi (880 km) south-southeast of Cape Race, Newfoundland.[14]

August 23
- 18:00 UTC (2:00 p.m. AST) at 36°18′N 40°48′W / 36.3°N 40.8°W – Tropical Depression Chantal degenerates into a remnant low, and subsequently dissipates about 823 mi (1,324 km) southeast of Cape Race.[14]
August 24
- 06:00 UTC (2:00 a.m. AST) at 10°18′N 46°24′W / 10.3°N 46.4°W – Tropical Depression Five forms from a tropical wave roughly 810 mi (1,300 km) east-southeast of Barbados.[15]
- 18:00 UTC (2:00 p.m. AST) at 10°36′N 48°42′W / 10.6°N 48.7°W – Tropical Depression Five strengthens into Tropical Storm Dorian.[15]
August 26
- 12:00 UTC (8:00 a.m. EDT) at 31°42′N 72°42′W / 31.7°N 72.7°W – Tropical Depression Six forms from a broad area of low pressure roughly 350 mi (560 km) south-southeast of Cape Hatteras, North Carolina.[16]
August 27
- 01:30 UTC (9:30 p.m. AST, August 26) at 25°18′N 71°00′W / 25.3°N 71.0°W – Tropical Storm Dorian makes landfall at Barbados with sustained winds of 52 mph (83 km/h).[15]
- 11:00 UTC (7:00 a.m. AST) at 14°00′N 60°54′W / 14.0°N 60.9°W – Tropical Storm Dorian makes landfall at Saint Lucia with sustained winds of 50 mph (85 km/h).[15]
- 18:00 UTC (2:00 p.m. EDT) at 31°18′N 71°36′W / 31.3°N 71.6°W – Tropical Depression Six strengthens into Tropical Storm Erin.[16]
August 28
- 06:00 UTC (2:00 a.m. EDT) at 32°12′N 72°24′W / 32.2°N 72.4°W – Tropical Storm Erin reaches peak intensity with maximum sustained winds of 40 mph (65 km/h) and a minimum barometric pressure of 1,002 mbar (29.59 inHg).[16]
- 15:30 UTC (11:30 a.m. AST) at 17°48′N 64°36′W / 17.8°N 64.6°W – Tropical Storm Dorian strengthens to a Category 1 hurricane, and simultaneously makes landfall at Saint Croix, United States Virgin Islands, with sustained winds of 75 mph (120 km/h).[15]
- 18:00 UTC (2:00 p.m. AST) at 18°24′N 65°06′W / 18.4°N 65.1°W – Hurricane Dorian makes landfall at Saint Thomas, U.S. Virgin Islands, with sustained winds of 80 mph (130 km/h).[15]
- 18:00 UTC (2:00 p.m. EDT) at 33°54′N 73°00′W / 33.9°N 73.0°W – Tropical Storm Erin weakens to a tropical depression.[16]
August 29
- 12:00 UTC (8:00 a.m. EDT) at 36°54′N 70°54′W / 36.9°N 70.9°W – Tropical Depression Erin transitions to an extratropical cyclone about 290 mi (460 km) east of Norfolk, Virginia and is later absorbed by a larger extratropical low.[16]
August 30
- 03:00 UTC (11:00 p.m. AST, August 29) at 23°18′N 68°24′W / 23.3°N 68.4°W – Hurricane Dorian strengthens to a Category 2 hurricane roughly 295 mi (470 km) east-northeast of the southeastern Bahamas.[17]
- 18:00 UTC (2:00 p.m. AST) at 24°48′N 70°18′W / 24.8°N 70.3°W – Hurricane Dorian strengthens to a Category 3 hurricane roughly 445 mi (715 km) east of the northwestern Bahamas.[18]
August 31
- 00:30 UTC (8:30 p.m. AST, August 30) at 25°18′N 71°00′W / 25.3°N 71.0°W – Hurricane Dorian strengthens to a Category 4 hurricane roughly 400 mi (645 km) east of the northwestern Bahamas.[19]
September edit

September 1
- 12:00 UTC (8:00 a.m. EDT) at 26°30′N 76°30′W / 26.5°N 76.5°W – Hurricane Dorian strengthens to a Category 5 hurricane about 35 mi (55 km) east of Great Abaco Island.[20]
- 16:40 UTC (12:40 p.m. EDT) at 26°30′N 77°00′W / 26.5°N 77.0°W – Hurricane Dorian reaches its peak intensity with maximum sustained winds of 185 mph (295 km/h) and a minimum pressure of 910 mbar (26.87 inHg), and simultaneously makes landfall at Elbow Cay in the Abaco Islands of the Bahamas.[15]
September 2
- 02:15 UTC (10:15 p.m. EDT, September 1) at 26°36′N 77°54′W / 26.6°N 77.9°W – Hurricane Dorian makes landfall at South Riding Point, Grand Bahama with maximum sustained winds of 180 mph (285 km/h).[15]
- 15:00 UTC (11:00 a.m. EDT) at 26°48′N 78°18′W / 26.8°N 78.3°W – Hurricane Dorian weakens to a Category 4 hurricane roughly 30 mi (50 km) northeast of Freeport, Bahamas.[21]
September 3
- 5:00 UTC (1:00 a.m. EDT) at 26°48′N 78°24′W / 26.8°N 78.4°W – Hurricane Dorian weakens to a Category 3 hurricane roughly 25 mi (40 km) northeast of Freeport, Bahamas.[22]
- 12:00 UTC (7:00 a.m. CDT) at 23°24′N 94°42′W / 23.4°N 94.7°W – Tropical Storm Fernand forms from an upper-level low roughly 200 mi (310 km) east of La Pesca, Tamaulipas.[23]
- 15:00 UTC (11:00 a.m. EDT) at 27°06′N 78°36′W / 27.1°N 78.6°W – Hurricane Dorian weakens to a Category 2 hurricane roughly 45 mi (70 km) north of Freeport, Bahamas.[24]
- 18:00 UTC (2:00 p.m. AST) at 18°06′N 32°06′W / 18.1°N 32.1°W – Tropical Depression Eight forms from a tropical wave roughly 455 mi (732 km) west of the Cabo Verde Islands.[25]
September 4
- 00:00 UTC (7:00 a.m. CDT, September 3) at 23°06′N 96°06′W / 23.1°N 96.1°W – Tropical Storm Fernand reaches peak intensity with maximum sustained winds of 50 mph (85 km/h) and a minimum barometric pressure of 1,000 mbar (29.53 inHg).[23]
- 00:00 UTC (8:00 p.m. AST, September 3) at 18°42′N 32°36′W / 18.7°N 32.6°W – Tropical Depression Eight strengthens to Tropical Storm Gabrielle.[25]
- 15:30 UTC (10:30 a.m. CDT) at 24°18′N 97°42′W / 24.3°N 97.7°W – Tropical Storm Fernand makes landfall about 30 mi (45 km) north-northeast of La Pesca.[23]
- 18:00 UTC (1:00 p.m. CDT) at 24°18′N 98°00′W / 24.3°N 98.0°W – Tropical Storm Fernand weakens to a tropical depression[23] and later dissipates roughly 130 mi (205 km) west-southwest of the mouth of Rio Grande River.[26]

September 5
- 03:00 UTC (11:00 p.m. EDT September 4) at 31°18′N 79°36′W / 31.3°N 79.6°W – Hurricane Dorian re-intensifies to a Category 3 hurricane roughly 105 mi (170 km) south of Charleston, South Carolina[27]
- 15:00 UTC (11:00 a.m. EDT) at 32°30′N 79°06′W / 32.5°N 79.1°W – Hurricane Dorian again weakens to a Category 2 hurricane roughly 50 mi (80 km) east-southeast of Charleston, South Carolina.[28]
September 6
- 12:30 UTC (8:30 a.m. EDT) at 35°18′N 75°30′W / 35.3°N 75.5°W – Hurricane Dorian makes landfall at Cape Hatteras, North Carolina with maximum sustained winds of 100 mph (155 km/h).[15]
September 7
- 18:00 UTC (2:00 p.m. AST) at 42°48′N 64°36′W / 42.8°N 64.6°W – Hurricane Dorian becomes a strong Category 1-equivalent post-tropical cyclone[15] about 140 mi (225 km) south-southwest of Halifax, Nova Scotia.[29]
- 22:15 UTC (6:15 p.m. AST) at 44°42′N 63°24′W / 44.7°N 63.4°W – Post-Tropical Cyclone Dorian makes landfall near Sambro Creek, Nova Scotia roughly 15 mi (25 km) south of Halifax with maximum sustained winds of 100 mph (155 km/h).[30]
September 8
- 06:00 UTC (2:00 a.m. AST) at 47°36′N 61°54′W / 47.6°N 61.9°W – Post-Tropical Cyclone Dorian becomes extratropical over the Gulf of St. Lawrence and is subsequently absorbed by a larger extratropical low over the northern Atlantic Ocean.[15]
- 18:00 UTC (2:00 p.m. AST) at 34°30′N 49°18′W / 34.5°N 49.3°W – Tropical Storm Gabrielle reaches peak intensity with maximum sustained winds of 65 mph (100 km/h) and a minimum barometric pressure of 995 mbar (29.38 inHg).
September 10
- 12:00 UTC (8:00 a.m. AST) at 43°18′N 39°06′W / 43.3°N 39.1°W – Tropical Storm Gabrielle transitions to an extratropical cyclone about 490 miles (790 km) northwest of the western Azores Islands and later dissipates.[25]
September 13
- 18:00 UTC (2:00 p.m. EDT) at 25°12′N 74°42′W / 25.2°N 74.7°W – Tropical Depression Nine forms from a tropical wave about 85 mi (140 km) east of Eleuthera Island, Bahamas.[31]
September 14
- 03:00 UTC (11:00 p.m. EDT, September 13) at 25°36′N 75°12′W / 25.6°N 75.2°W – Tropical Depression Nine strengthens to Tropical Storm Humberto about 225 mi (365 km) east-southeast of Freeport, Bahamas.[32]

September 16
- 00:00 UTC (8:00 p.m. EDT, September 15) at 29°06′N 78°06′W / 29.1°N 78.1°W – Tropical Storm Humberto strengthens to a Category 1 hurricane about 170 mi (270 km) east-northeast of Cape Canaveral, Florida.[31]
September 17
- 00:00 UTC (8:00 p.m. AST, September 10) at 12°48′N 43°30′W / 12.8°N 43.5°W – Tropical Depression Ten forms from a tropical wave about 1,090 mi (1,760 km) east of the Windward Islands.[33]
- 12:00 UTC (8:00 a.m. EDT) at 30°36′N 74°00′W / 30.6°N 74.0°W – Hurricane Humberto intensifies into a Category 2 hurricane roughly 555 mi (895 km) west of Bermuda.[34]
- 12:00 UTC (7:00 a.m. CDT) at 28°18′N 95°42′W / 28.3°N 95.7°W – Tropical Depression Eleven forms from a mid- to upper-level trough about 45 mi (75 km) southwest of Freeport, Texas.[35]
- 15:00 UTC (10:00 a.m. CDT) at 28°36′N 95°30′W / 28.6°N 95.5°W – Tropical Depression Eleven strengthens to Tropical Storm Imelda.[35]
- 17:45 UTC (12:45 p.m. CDT) at 28°54′N 95°24′W / 28.9°N 95.4°W – Tropical Storm Imelda attains peak intensity with maximum sustained winds of 45 mph (75 km/h) and a minimum barometric pressure of 1,003 mbar (29.62 inHg), and simultaneously makes landfall near Freeport.[35]
September 18
- 00:00 UTC (8:00 p.m. AST September 17) at 31°12′N 71°36′W / 31.2°N 71.6°W – Hurricane Humberto strengthens to a Category 3 hurricane roughly 405 mi (655 km) west-southwest of Bermuda.[36]
- 00:00 UTC (7:00 p.m. CDT September 17) at 29°36′N 95°24′W / 29.6°N 95.4°W – Tropical Storm Imelda weakens to a tropical depression roughly 5 mi (10 km) north of Houston, Texas.[37]
- 06:00 UTC (2:00 a.m. AST) at 14°00′N 47°24′W / 14.0°N 47.4°W – Tropical Depression Ten strengthens to Tropical Storm Jerry.[33]
- 18:00 UTC (2:00 p.m. AST) at 32°30′N 67°12′W / 32.5°N 67.2°W – Hurricane Humberto reaches peak intensity with maximum sustained winds of 125 mph (200 km/h) and a minimum barometric pressure of 950 mbar (28.05 inHg).[31]
September 19
- 00:00 UTC (7:00 p.m. CDT, September 18) at 31°06′N 94°48′W / 31.1°N 94.8°W – Tropical Depression Imelda degenerates into a trough about 120 mi (190 km) north-northeast of Houston, and subsequently dissipates.[35]
- 12:00 UTC (8:00 a.m. AST) at 36°00′N 60°48′W / 36.0°N 60.8°W – Hurricane Humberto weakens to a Category 2 hurricane.[31]
- 12:00 UTC (8:00 a.m. AST) at 16°30′N 53°48′W / 16.5°N 53.8°W – Tropical Storm Jerry strengthens to a Category 1 hurricane about 520 mi (830 km) east of the Leeward Islands.[33]
- 18:00 UTC (2:00 p.m. AST) at 37°42′N 59°18′W / 37.7°N 59.3°W – Hurricane Humberto weakens to a Category 1 hurricane.[31]
September 20
- 00:00 UTC (8:00 p.m. AST September 19) at 39°06′N 58°30′W / 39.1°N 58.5°W – Hurricane Humberto transitions to an extratropical cyclone about 580 mi (930 km) south-southwest of Cape Race, Newfoundland and later merges with a larger extratropical low and frontal system.[31]
- 00:00 UTC (8:00 p.m. AST September 19) at 17°42′N 56°36′W / 17.7°N 56.6°W – Hurricane Jerry strengthens to a Category 2 hurricane and simultaneously attains maximum intensity with maximum sustained winds of 105 mph (170 km/h) and a minimum barometric pressure of 976 mbar (28.82 inHg).[33]
- 15:00 UTC (11:00 a.m. AST) at 18°48′N 60°18′W / 18.8°N 60.3°W – Hurricane Jerry weakens into a Category 1 hurricane roughly 130 mi (205 km) northeast of Barbuda and 190 mi (300 km) east-northeast of Anguilla.[38]
September 21
- 00:00 UTC (8:00 p.m. AST, September 20) at 21°06′N 62°24′W / 21.1°N 62.4°W – Hurricane Jerry weakens to a tropical storm as it passes about 140 mi (220 km) north of the Leeward Islands.[33]
September 22
- 00:00 UTC (8:00 p.m. AST September 21) at 11°30′N 58°48′W / 11.5°N 58.8°W – Tropical Depression forms from a tropical wave about 120 mi (190 km) east of Tobago.[39]
- 06:00 UTC (2:00 a.m. AST) at 11°48′N 59°54′W / 11.8°N 59.9°W – Tropical depression strengthens to Tropical Storm Karen.[39]
September 23
- 00:00 UTC (8:00 p.m. AST September 22) at 11°00′N 20°24′W / 11.0°N 20.4°W – Tropical Depression Thirteen forms from a tropical wave about 320 mi (520 km) southwest of Dakar, Senegal.[40]
- 06:00 UTC (2:00 a.m. AST) at 11°00′N 21°54′W / 11.0°N 21.9°W – Tropical Depression Thirteen strengthens to Tropical Storm Lorenzo.[40]
- 06:00 UTC (2:00 a.m. AST) at 13°42′N 64°06′W / 13.7°N 64.1°W – Tropical Storm Karen weakens to a tropical depression[39] about 160 mi (260 km) west of Saint Vincent and about 315 mi (510 km) south-southeast of Saint Croix, U.S. Virgin Islands.[41]
September 24
- 06:00 UTC (2:00 a.m. AST) at 16°24′N 65°48′W / 16.4°N 65.8°W – Tropical Depression Karen re-strengthens to a tropical storm about 120 mi (190 km) south-southwest of Isla de Vieques, Puerto Rico.[39]
- 18:00 UTC (2:00 p.m. AST) at 30°54′N 69°06′W / 30.9°N 69.1°W – Tropical Storm Jerry transitions to a post-tropical cyclone about 282 mi (454 km) west-southwest of Bermuda and subsequently degenerates into an extratropical trough of low pressure.[33]
- 22:00 UTC (6:00 p.m. AST) at 18°06′N 65°24′W / 18.1°N 65.4°W – Tropical Storm Karen makes landfall at Vieques with sustained winds of 45 mph (75 km/h).[39]
- 23:00 UTC (7:00 p.m. AST) at 18°18′N 65°18′W / 18.3°N 65.3°W – Tropical Storm Karen makes landfall at Isla Culebra, Puerto Rico with sustained winds of 45 mph (75 km/h).[39]
September 25
- 00:00 UTC (8:00 p.m. AST September 24) at 18°30′N 65°12′W / 18.5°N 65.2°W – Tropical Storm Karen attains its lowest barometric pressure of 1,003 mbar (29.62 inHg).[39]
- 06:00 UTC (2:00 a.m. AST) at 13°24′N 33°00′W / 13.4°N 33.0°W – Tropical Storm Lorenzo strengthens to a Category 1 hurricane.[40]
September 26
- 00:00 UTC (8:00 p.m. AST September 25) at 14°30′N 37°30′W / 14.5°N 37.5°W – Hurricane Lorenzo strengthens to a Category 2 hurricane.[40]
- 12:00 UTC (8:00 a.m. AST) at 15°12′N 39°48′W / 15.2°N 39.8°W – Hurricane Lorenzo strengthens to a Category 3 hurricane.[40]
- 18:00 UTC (2:00 p.m. AST) at 16°00′N 40°36′W / 16.0°N 40.6°W – Hurricane Lorenzo strengthens to a Category 4 hurricane.[40]
September 27
- 12:00 UTC (8:00 a.m. AST) at 28°48′N 60°00′W / 28.8°N 60.0°W – Tropical Storm Karen weakens to a tropical depression and dissipates shortly thereafter over the central Atlantic Ocean, about 350 mi (560 km) southeast of Bermuda.[39]
- 18:00 UTC (2:00 p.m. AST) at 19°36′N 43°30′W / 19.6°N 43.5°W – Hurricane Lorenzo weakens to a Category 3 hurricane.[40]
September 28
- 18:00 UTC (2:00 p.m. AST) at 22°54′N 45°00′W / 22.9°N 45.0°W – Hurricane Lorenzo re-strengthens to a Category 4 hurricane.[40]

September 29
- 03:00 UTC (11:00 p.m. AST September 28) at 24°18′N 45°00′W / 24.3°N 45.0°W – Hurricane Lorenzo strengthens to a Category 5 hurricane, and simultaneously reaches its peak intensity with maximum sustained winds of 160 mph (260 km/h) and a minimum barometric pressure of 925 mbar (27.32 inHg) about 1,600 (2,600 km) southwest of the Azores.[40]
- 06:00 UTC (2:00 a.m. AST) at 24°42′N 45°00′W / 24.7°N 45.0°W – Hurricane Lorenzo weakens to a Category 4 hurricane.[40]
- 12:00 UTC (8:00 a.m. AST) at 25°36′N 44°48′W / 25.6°N 44.8°W – Hurricane Lorenzo weakens to a Category 3 hurricane.[40]
- 18:00 UTC (2:00 p.m. AST) at 26°24′N 44°24′W / 26.4°N 44.4°W – Hurricane Lorenzo weakens to a Category 2 hurricane.[40]
October edit
October 2
- 06:00 UTC (2:00 a.m. AST) at 40°12′N 31°24′W / 40.2°N 31.4°W – Hurricane Lorenzo weakens to a Category 1 hurricane[40] about 55 mi (90 km) north of Flores Island, Azores.[42]
- 12:00 UTC (8:00 a.m. AST) at 43°00′N 28°00′W / 43.0°N 28.0°W – Hurricane Lorenzo becomes a frontal post-tropical cyclone about 280 mi (440 km) north of Graciosa Island, Azores, and subsequently dissipates over northwest Ireland.[40]
October 11
- 06:00 UTC (2:00 a.m. AST) at 38°24′N 68°42′W / 38.4°N 68.7°W – Subtropical Storm Melissa forms from a nor'easter[43] about 210 mi (330 km) south-southeast of Nantucket, Massachusetts and simultaneously attains its peak intensity with maximum sustained winds of 63 mph (102 km/h) and a minimum barometric pressure of 994 mbar (29.35 inHg).[44]
October 12
- 12:00 UTC (8:00 a.m. AST) at 38°00′N 67°30′W / 38.0°N 67.5°W – Subtropical Storm Melissa transitions to a tropical storm about 260 mi (430 km) south-southeast of Nantucket.[44]
October 14
- 12:00 UTC (8:00 a.m. AST) at 40°48′N 52°54′W / 40.8°N 52.9°W – Tropical Storm Melissa becomes extratropical about 400 mi (650 km) south of Cape Race, Newfoundland as it merges with a nearby front and dissipates.[44]
- 12:00 UTC (8:00 a.m. AST) at 12°36′N 19°18′W / 12.6°N 19.3°W – Tropical Depression Fifteen forms from a tropical wave about 350 mi (560 km) southeast of the Cabo Verde Islands with maximum sustained winds of 35 mph (56 km/h) and a minimum barometric pressure of 1,006 mbar (29.71 inHg).[45]
October 16
- 06:00 UTC (2:00 a.m. AST) at 17°36′N 24°24′W / 17.6°N 24.4°W – Tropical Depression Fifteen degenerates into a broad area of low pressure near the Barlavento Islands group of the Cape Verde Islands and subsequently dissipates.[45]
October 18
- 18:00 UTC (1:00 p.m. CDT) at 26°18′N 89°30′W / 26.3°N 89.5°W – Tropical Storm Nestor forms from a tropical wave over the Bay of Campeche[46] about 195 mi (315 km) south of the mouth of the Mississippi River.[47]
October 19
- 00:00 UTC (7:00 p.m. CDT, October 18) at 27°48′N 87°48′W / 27.8°N 87.8°W – Tropical Storm Nestor reaches its peak intensity with maximum sustained winds of 60 mph (95 km/h) and a minimum barometric pressure of 996 mbar (hPa; 29.42 inHg)[46] about 140 mi (220 km) southeast of the mouth of the Mississippi River and about 215 mi (340 km) southwest of Panama City, Florida.[48]
- 15:00 UTC (10:00 a.m. CDT) at 29°18′N 86°18′W / 29.3°N 86.3°W – Tropical Storm Nestor becomes a post-tropical cyclone about 70 mi (115 km) of Panama City and about 85 mi (135 km) west-southwest of Apalachicola, Florida.[49]
- 18:00 UTC (1:00 p.m. CDT) at 29°42′N 85°06′W / 29.7°N 85.1°W – Post-Tropical Cyclone Nestor moves inland at St. Vincent Island, Florida, about 5 mi (10 km) west-southwest of Apalachicola,[50] and subsequently degenerates into an open trough after moving offshore of the Virginia Atlantic coast.[46]
October 25
- 00:00 UTC (8:00 p.m. AST, October 24) at 35°54′N 35°06′W / 35.9°N 35.1°W – A subtropical storm develops from an extratropical area of low pressure about 400 mi (650 km) west-southwest of the western Azores.[d][52]
- 12:00 UTC (7:00 a.m. CDT) at 24°42′N 94°48′W / 24.7°N 94.8°W – Tropical Storm Olga forms from a tropical wave over the western Gulf of Mexico, about 390 mi (630 km) south-southwest of Lake Charles, Louisiana.[53]
- 18:00 UTC (1:00 p.m. CDT) at 25°54′N 93°36′W / 25.9°N 93.6°W – Tropical Storm Olga reaches its peak intensity with maximum sustained winds of 45 mph (75 km/h) and a minimum barometric pressure of 998 mbar (hPa; 29.47 inHg).[53]
- 18:00 UTC (12:00 p.m. AST) at 35°54′N 32°42′W / 35.9°N 32.7°W – The subtropical storm west-southwest of the Azores transitions into Tropical Storm Pablo.[52]
October 26
- 00:00 UTC (7:00 p.m. CDT, September 25) at 27°00′N 92°30′W / 27.0°N 92.5°W – Tropical Storm Olga becomes a post-tropical cyclone.[53]
- 07:00 UTC (2:00 a.m. CDT) at 29°12′N 91°12′W / 29.2°N 91.2°W – Post-tropical Cyclone Olga comes ashore south of Morgan City, Louisiana,[54] and subsequently dissipates over Central Ontario.[53]

October 27
- 12:00 UTC (8:00 a.m. AST) at 41°54′N 18°48′W / 41.9°N 18.8°W – Tropical Storm Pablo strengthens to a Category 1 hurricane after passing just southeast of the Azores.[53]
- 18:00 UTC (2:00 p.m. AST) at 44°06′N 17°18′W / 44.1°N 17.3°W – Hurricane Pablo reaches its peak intensity with maximum sustained winds of 80 mph (130 km/h) and a minimum barometric pressure of 977 mbar (hPa; 28.85 inHg)[53] roughly 650 mi (1,050 km) northeast of Lajes Air Base in the Azores.[55]
October 28
- 00:00 UTC (8:00 p.m. AST October 27) at 45°30′N 17°00′W / 45.5°N 17.0°W – Hurricane Pablo weakens to a tropical storm.
- 12:00 UTC (8:00 a.m. AST) at 46°30′N 17°54′W / 46.5°N 17.9°W – Tropical Storm Pablo transitions into an extratropical cyclone about 720 miles (1,160 km) north-northeast of the eastern Azores and later dissipates.[52]
October 30
- 12:00 UTC (8:00 a.m. AST) at 38°18′N 40°42′W / 38.3°N 40.7°W – Subtropical Storm Rebekah forms from an extratropical low about 630 mi (1,020 km) west of Flores Island in the western Azores, and simultaneously attains its peak intensity with maximum sustained winds of 50 mph (85 km/h) and a minimum barometric pressure of 982 mbar (29.00 inHg).[56]
November edit
November 1
- 06:00 UTC (2:00 a.m. AST) at 40°36′N 30°12′W / 40.6°N 30.2°W – Subtropical Storm Rebekah becomes extratropical and later dissipates about 120 mi (190 km) north of the Azores.[56]
November 19
- 06:00 UTC (2:00 a.m. AST) at 19°24′N 58°06′W / 19.4°N 58.1°W – Tropical Storm Sebastien forms from a large area of disturbed weather about 270 mi (435 km) northeast of the Leeward Islands.[57]
November 23
- 00:00 UTC (8:00 p.m. AST, November 22) at 26°42′N 52°36′W / 26.7°N 52.6°W – Tropical Storm Sebastien reaches its peak intensity with maximum sustained winds of 70 mph (110 km/h) and a minimum barometric pressure of 991 mbar (hPa; 29.36 inHg).[57]
November 25
- 00:00 UTC (8:00 p.m. AST, November 24) at 40°00′N 30°54′W / 40.0°N 30.9°W – Tropical Storm Sebastien transitions into an extratropical cyclone near Flores Island, Azores and subsequently dissipates near Greater London.[57]
November 30
- The 2019 Atlantic hurricane season officially ends.[3]
See also edit
Notes edit
- ^ An average Atlantic hurricane season, as defined by the National Oceanic and Atmospheric Administration, has 12 tropical storms, seven hurricanes and three major hurricanes.[1]
- ^ Hurricanes reaching Category 3 (111 miles per hour (179 km/h)) and higher on the 5-level Saffir–Simpson wind speed scale are considered major hurricanes.[4]
- ^ The National Hurricane Center began issuing Potential Tropical Cyclone advisories on this system at 15:00 UTC on September 10, as there was a high chance that the disturbance would soon become a tropical depression or tropical storm.[12]
- ^ Undetected at the time of its formation within the larger extratropical system, the subtropical storm was never designed as such by the National Hurricane Center (NHC). The storm was fully tropical by the time the NHC issued its first forecast and advisory at 21:00 UTC on October 25).[51][52]
References edit
- ^ "Background Information: North Atlantic Hurricane Season". College Park, Maryland: NOAA Climate Prediction Center. Retrieved August 6, 2020.
- ^ a b Gaches, Lauren (November 26, 2019). "Active 2019 Atlantic hurricane season comes to an end". Washington, D.C.: National Oceanic and Atmospheric Administration. Retrieved June 29, 2020.
- ^ a b c Dorst, Neal (June 1, 2018). "Hurricane Season Information". Frequently Asked Questions About Hurricanes. Miami, Florida: NOAA Atlantic Oceanographic and Meteorological Laboratory. Retrieved June 29, 2020.
- ^ "Saffir-Simpson Hurricane Wind Scale". Miami, Florida: National Hurricane Center. Retrieved August 6, 2020.
- ^ Karimi, Faith; Thornton, Chandler (September 12, 2019). "1,300 people are listed as missing nearly 2 weeks after Hurricane Dorian hit the Bahamas". CNN. Retrieved July 10, 2020.
- ^ Miller, Kimberly (September 30, 2019). "Hurricane Lorenzo should never have made it to a Cat 5, but it did". The Palm Beach Post. West Palm Beach, Florida. Retrieved July 10, 2020.
- ^ Fedschun, Travis (2019-09-30). "Hurricane Lorenzo sinks tugboat carrying 14 crew members; at least 1 found dead at sea, 3 rescued". Fox News. Retrieved 2021-03-21.
- ^ "WMO Hurricane Committee retires tropical cyclone names and ends the use of Greek alphabet". Geneva, Switzerland: World Meteorological Organization. March 17, 2021. Archived from the original on December 18, 2023. Retrieved April 29, 2021.
- ^ "Understanding the Date/Time Stamps". Miami, Florida: NOAA National Hurricane Center. Retrieved July 10, 2020.
- ^ "Update on National Hurricane Center Products and Services for 2020" (PDF). Miami, Florida: National Hurricane Center. April 20, 2020. Retrieved May 17, 2020.
- ^ a b c Andrew S. Latto (August 6, 2019). Subtropical Storm Andrea (PDF) (Report). Miami, Florida: National Hurricane Center. Retrieved August 24, 2020.
- ^ a b c d e f g h John P. Cangialosi; Andrew B. Hagen; Robbie Berg (November 19, 2019). Hurricane Barry (PDF) (Report). Miami, Florida: National Hurricane Center. Retrieved August 24, 2020.
- ^ a b c David A. Zelinsky (August 19, 2019). Tropical Depression Three (PDF) (Report). Miami, Florida: National Hurricane Center. Retrieved August 24, 2020.
- ^ a b c d Robbie Berg (October 25, 2019). Tropical Storm Chantal (PDF) (Report). Miami, Florida: National Hurricane Center. Retrieved August 24, 2020.
- ^ a b c d e f g h i j k Lixion A. Avila; Stacy Stewart; Robbie Berg; Andrew B. Hagen (April 20, 2020). Hurricane Dorian (PDF) (Report). Miami, Florida: National Hurricane Center. Retrieved August 24, 2020.
- ^ a b c d e Eric S. Blake (November 15, 2019). Tropical Storm Erin (PDF) (Report). Miami, Florida: National Hurricane Center. Retrieved August 24, 2020.
- ^ Eric Blake (August 30, 2019). Hurricane Dorian Intermediate Advisory Number 23 (Report). Miami, Florida: National Hurricane Center. Retrieved September 19, 2019.
- ^ Lixion Avila (August 30, 2019). Hurricane Dorian Intermediate Advisory Number 25A (Report). Miami, Florida: National Hurricane Center. Retrieved September 19, 2019.
- ^ John Cangialosi; Andrew Latto (August 31, 2019). Hurricane Dorian Tropical Cyclone Update (Report). Miami, Florida: National Hurricane Center. Retrieved September 19, 2019.
- ^ Lixion Avila (September 1, 2019). Hurricane Dorian Intermediate Advisory Number 32A (Report). Miami, Florida: National Hurricane Center. Retrieved September 19, 2019.
- ^ Daniel Brown (September 2, 2019). Hurricane Dorian Advisory Number 37 (Report). Miami, Florida: National Hurricane Center. Retrieved December 1, 2019.
- ^ Robbie Berg (September 3, 2019). Hurricane Dorian Tropical Cyclone Update (Report). Miami, Florida: National Hurricane Center. Retrieved December 1, 2019.
- ^ a b c d Richard J. Pasch (January 14, 2020). Tropical Storm Fernand (PDF) (Report). Miami, Florida: National Hurricane Center. Retrieved August 24, 2020.
- ^ Daniel Brown (September 3, 2019). Hurricane Dorian Advisory Number 41 (Report). Miami, Florida: National Hurricane Center. Retrieved December 1, 2019.
- ^ a b c John L. Beven (January 3, 2020). Tropical Storm Gabrielle (PDF) (Report). Miami, Florida: National Hurricane Center. Retrieved August 24, 2020.
- ^ John Cangialosi (September 5, 2019). Remnants Of Fernand Advisory Number 8 (Report). Miami, Florida: National Hurricane Center. Retrieved December 13, 2019.
- ^ Lixion Avila (September 4, 2019). Hurricane Dorian Advisory Number 47 (Report). Miami, Florida: National Hurricane Center. Retrieved December 1, 2019.
- ^ Jack Beven (September 5, 2019). Hurricane Dorian Advisory Number 49 (Report). Miami, Florida: National Hurricane Center. Retrieved December 1, 2019.
- ^ Jack Beven (September 7, 2019). Hurricane Dorian Special Advisory Number 58 (Report). Miami, Florida: National Hurricane Center. Retrieved August 25, 2020.
- ^ Eric Blake; Lixion Avila (September 7, 2019). Post-Tropical Cyclone Dorian Tropical Cyclone Update (Report). Miami, Florida: National Hurricane Center. Retrieved December 1, 2019.
- ^ a b c d e f Stacy Stewart (February 19, 2020). hurricane Humberto (PDF) (Report). Miami, Florida: National Hurricane Center. Retrieved August 28, 2020.
- ^ John Cangialosi (September 14, 2019). Tropical Storm Humberto Advisory Number 6 (Report). Miami, Florida: National Hurricane Center. Retrieved December 14, 2019.
- ^ a b c d e f Daniel Brown (December 11, 2019). Hurricane Jerry (PDF) (Report). Miami, Florida: National Hurricane Center. Retrieved August 28, 2020.
- ^ Stacy Stewart (September 17, 2019). Hurricane Humberto Intermediate Advisory Number 19A (Report). Miami, Florida: National Hurricane Center. Retrieved December 14, 2019.
- ^ a b c d Andy Latto; Robbie Berg (February 7, 2020) [Original date January 29, 2020]. Tropical Storm Imelda (PDF) (Report). Miami, Florida: National Hurricane Center. Retrieved August 28, 2020.
- ^ Richard Pasch (September 18, 2019). Hurricane Humberto Intermediate Advisory Number 21A (Report). Miami, Florida: National Hurricane Center. Retrieved December 14, 2019.
- ^ Richard Pasch (September 18, 2019). Tropical Depression Imelda Intermediate Advisory Number 2A (Report). Miami, Florida: National Hurricane Center. Retrieved January 10, 2020.
- ^ Eric Blake (September 20, 2019). Hurricane Jerry Advisory Number 13 (Report). Miami, Florida: National Hurricane Center. Retrieved January 10, 2020.
- ^ a b c d e f g h John P. Cangialosi; Nelsie A. Ramos (December 16, 2019). Tropical Storm Karen (PDF) (Report). Miami, Florida: National Hurricane Center. Retrieved August 28, 2020.
- ^ a b c d e f g h i j k l m n David A. Zelinsky (December 16, 2019). Hurricane Lorenzo (PDF) (Report). Miami, Florida: National Hurricane Center. Retrieved August 28, 2020.
- ^ Stacy Stewart (September 23, 2019). Tropical Storm Karen Intermediate Advisory Number 4A (Report). Miami Florida: National Hurricane Center. Retrieved August 28, 2020.
- ^ Stacy Stewart (October 2, 2019). Hurricane Lorenzo Intermediate Advisory Number 39A...Corrected (Report). Miami, Florida: National Hurricane Center. Retrieved August 28, 2020.
- ^ Andy Latto (October 11, 2019). Subtropical Storm Melissa Advisory Number 1 (Report). Miami, Florida: National Hurricane Center. Retrieved August 24, 2020.
- ^ a b c Robbie Berg (December 31, 2019). Tropical Storm Melissa (PDF) (Report). Miami, Florida: National Hurricane Center. Retrieved August 24, 2020.
- ^ a b Lixion A. Avila (November 1, 2019). Tropical Depression Fifteen (PDF) (Report). Miami, Florida: National Hurricane Center. Retrieved August 24, 2020.
- ^ a b c Andrew B. Hagen; Eric Blake; Robbie Berg (February 28, 2020). Tropical Storm Nestor (PDF) (Report). Miami, Florida: National Hurricane Center. Retrieved August 30, 2020.
- ^ Michael Brennan (October 18, 2019). Tropical Storm Nestor Intermediate Advisory Number 5A (Report). Miami, Florida: National Hurricane Center. Retrieved June 26, 2020.
- ^ John Cangialosi (Oct 18, 2019). Tropical Storm Nestor Intermediate Advisory Number 6A...Corrected (Report). Miami, Florida: National Hurricane Center. Retrieved June 26, 2020.
- ^ Stacy Stewart (October 19, 2019). Post-Tropical Cyclone Nestor Advisory Number 9 (Report). Miami, Florida: National Hurricane Center. Retrieved June 26, 2020.
- ^ Stacy Stewart (October 19, 2019). Post-Tropical Cyclone Nestor Intermediate Advisory Number 9A (Report). Miami, Florida: National Hurricane Center. Retrieved June 26, 2020.
- ^ Avila, Lixion (October 25, 2019). Tropical Storm Pablo Discussion Number 1 (Report). Miami, Florida: National Hurricane Center. Retrieved July 22, 2023.
- ^ a b c d John L. Beven (January 27, 2020). Hurricane Pablo (PDF) (Report). Miami, Florida: National Hurricane Center. Retrieved August 30, 2020.
- ^ a b c d e f Richard J. Pasch; Robbie Berg; Andrew B. Hagen (March 19, 2020). Tropical Storm Olga (PDF) (Report). Miami, Florida: National Hurricane Center. Retrieved August 30, 2020.
- ^ "How Tropical Storm Olga changed as it moved to Louisiana". New Orleans, Louisiana: WWL-TV. October 28, 2019. Retrieved August 30, 2020.
- ^ Andrew Latto (October 27, 2019). Hurricane Pablo Advisory Number 9 (Report). Miami, Florida: National Hurricane Center. Retrieved June 26, 2020.
- ^ a b Stacy Stewart (December 9, 2019). Subtropical Storm Rebekah (PDF) (Report). Miami, Florida: National Hurricane Center. Retrieved August 24, 2020.
- ^ a b c Daniel P. Brown (February 3, 2020). Tropical Storm Sebastien (PDF) (Report). Miami, Florida: National Hurricane Center. Retrieved August 24, 2020.
External links edit
- 2019 Tropical Cyclone Advisory Archive, National Hurricane Center and Central Pacific Hurricane Center
- Hurricanes and Tropical Storms – Annual 2019, National Centers for Environmental Information