
KNOWPIA
WELCOME TO KNOWPIA

Urique 
Summary
Urique (Tarahumara: Urike) is a town and seat of the municipality of Urique, in the northern Mexican state of Chihuahua. As of 2010, the town of Urique had a population of 1,102,[1] up from 984 as of 2005.[2] Located in the southwest corner of the state in the region of the cliffs, the town is at the bottom of the valley Barranca de Urique, formed by the river of the same name, due to its relatively low elevation above sea level (about 550 meters) the climate of Urique is close to tropical. It's the principal village of the Municipality of Urique.
Urique | |
|---|---|
Town | |
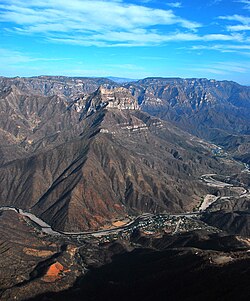 The town of Urique in the Urique Canyon | |
 Urique Location in Mexico | |
| Coordinates: 27°13′0″N 107°55′0″W / 27.21667°N 107.91667°W | |
| Country | |
| State | Chihuahua |
| Municipality | Urique |
| Elevation | 550 m (1,800 ft) |
| Population (2010) | |
| • Total | 1,102 |
Geography edit
Climate edit
| Climate data for Urique (1951–2010) | |||||||||||||
|---|---|---|---|---|---|---|---|---|---|---|---|---|---|
| Month | Jan | Feb | Mar | Apr | May | Jun | Jul | Aug | Sep | Oct | Nov | Dec | Year |
| Record high °C (°F) | 38.0 (100.4) |
38.0 (100.4) |
41.0 (105.8) |
43.0 (109.4) |
45.5 (113.9) |
47.0 (116.6) |
46.0 (114.8) |
43.0 (109.4) |
43.5 (110.3) |
43.0 (109.4) |
40.0 (104.0) |
36.0 (96.8) |
47.0 (116.6) |
| Mean daily maximum °C (°F) | 26.5 (79.7) |
28.6 (83.5) |
31.3 (88.3) |
34.9 (94.8) |
38.2 (100.8) |
39.9 (103.8) |
35.4 (95.7) |
35.1 (95.2) |
35.4 (95.7) |
34.5 (94.1) |
31.2 (88.2) |
27.4 (81.3) |
33.2 (91.8) |
| Daily mean °C (°F) | 18.1 (64.6) |
19.4 (66.9) |
21.7 (71.1) |
25.1 (77.2) |
28.6 (83.5) |
31.2 (88.2) |
28.7 (83.7) |
28.2 (82.8) |
28.0 (82.4) |
25.7 (78.3) |
22.0 (71.6) |
18.8 (65.8) |
24.6 (76.3) |
| Mean daily minimum °C (°F) | 9.6 (49.3) |
10.1 (50.2) |
12.0 (53.6) |
15.3 (59.5) |
19.1 (66.4) |
22.6 (72.7) |
21.9 (71.4) |
21.4 (70.5) |
20.5 (68.9) |
16.9 (62.4) |
12.8 (55.0) |
10.2 (50.4) |
16.0 (60.8) |
| Record low °C (°F) | 0.0 (32.0) |
1.0 (33.8) |
0.5 (32.9) |
7.0 (44.6) |
11.0 (51.8) |
10.5 (50.9) |
17.0 (62.6) |
17.5 (63.5) |
14.0 (57.2) |
9.5 (49.1) |
5.5 (41.9) |
1.5 (34.7) |
0.0 (32.0) |
| Average precipitation mm (inches) | 41.2 (1.62) |
22.6 (0.89) |
15.1 (0.59) |
5.7 (0.22) |
10.7 (0.42) |
79.6 (3.13) |
187.7 (7.39) |
169.3 (6.67) |
115.1 (4.53) |
52.1 (2.05) |
20.0 (0.79) |
50.2 (1.98) |
769.3 (30.29) |
| Average precipitation days (≥ 0.1 mm) | 3.9 | 2.4 | 1.8 | 0.9 | 1.0 | 7.8 | 19.1 | 16.6 | 10.2 | 4.0 | 2.3 | 3.9 | 73.9 |
| Source: Servicio Meteorologico Nacional[3] | |||||||||||||
References edit
- ^ "Urique". Catálogo de Localidades. Secretaría de Desarrollo Social (SEDESOL). Retrieved 23 April 2014.
- ^ Instituto Nacional de Estadística y Geografía. Principales resultados por localidad 2005 (ITER). Retrieved on October 25, 2008
- ^ "Estado de Chihuahua-Estacion: Urique (SMN)". Normales Climatologicas 1951–2010 (in Spanish). Servicio Meteorologico Nacional. Archived from the original on 17 March 2019. Retrieved 17 March 2019.