


Summary
Visual hierarchy, according to Gestalt psychology, is a pattern in the visual field wherein some elements tend to "stand out," or attract attention, more strongly than other elements, suggesting a hierarchy of importance.[1] While it may occur naturally in any visual field, the term is most commonly used in design (especially graphic design and cartography), where elements are intentionally designed to make some look more important than others. This order is created by the visual contrast between forms in a field of perception. Objects with highest contrast to their surroundings are recognized first by the human mind.

Evidence edit
There is some scientific evidence for visual hierarchy using eye tracking. For example, one study found that when people agree that a graphic design is good, they exhibit more similar eye movements; measured by the Fréchet distance.[2]
Theory edit
The concept of visual hierarchy is based in Gestalt psychological theory, an early 20th-century German theory that proposes that the human brain has innate organizing tendencies that “structure individual elements, shapes or forms into a coherent, organized whole,” especially when processing visual information.[3] The German word Gestalt translates into “form,” “pattern,” or “shape” in English.[4] When an element in a visual field disconnects from the ‘whole’ created by the brain's perceptual organization, it “stands out” to the viewer. The shapes that disconnect most severely from their surroundings stand out the most. This is commonly encapsulated as the Von Restorff effect, which states that isolation attracts attention.
Physical characteristics edit
The brain disassociates objects from one another based upon the differences between their physical characteristics. These characteristics fall into four categories: color, size, alignment, and character.[5] Each type of contrast can be used to construct a visual hierarchy. The same characteristics are also sometimes categorized (especially among cartographers) according to the visual variables of Jacques Bertin.[6]
- Color encompasses the hue, saturation, value, and perceived texture of forms.[7] Dark figures will stand out on a light background, light figures will stand out on a dark background, brightly-colored figures will stand out on a muted background, and so on. The fluorescent colors used for tennis balls and other sports equipment is intended to make them instantly stand out against almost any natural visual field.
- Size has a strong influence on visual hierarchy. Large elements will almost always attract attention, as long as they can be recognized as figures.
- Alignment is the arrangement of forms relative to one another. For example, items in the upper left corner of a page are often seen first (at least for those readers accustomed to western languages), the center of the field has prominence. Negative space can also be employed: a figure isolated among large amounts of white space will stand out more than one amid other figures.
- Character includes several kinds of contrasts based on shape. For example, complex patterns attract more attention than simple or predictable patterns, intricate shapes attract more attention than generalized ones. Even large-scale patterns can attract attention if they contrast with the pattern in the remainder of the visual field.
Camouflage is an example of eliminating contrast in character in color and/or character specifically to reduce visual hierarchy.
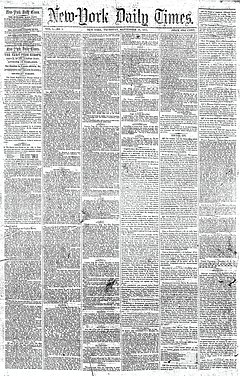
The "squint test" is often suggested as a simple, if unscientific, method to evaluate the visual hierarchy of a graphical product like a map or web page.[8] When viewed out of focus (or from a great distance), the viewer is not distracted by details, but can only see overall (gestalt) patterns such as visual hierarchy. All of the above patterns, except some aspects of character, are recognizable by this method.
Application edit

Visual hierarchy is an important concept in the field of graphic design, a field that specializes in visual organization. Designers attempt to control visual hierarchy to guide the eye to information in a specific order for a specific purpose. One could compare visual hierarchy in graphic design to grammatical structure in writing in terms of the importance of each principle to these fields.
Cartography edit
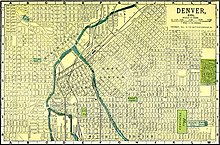
In cartographic design, visual hierarchy is used to emphasize certain important features on a map over less important features.[9] Typically, a map has a purpose that dictates a conceptual hierarchy of what should be more or less important, so one of the goals of the choice of map symbols is to match the visual hierarchy to the conceptual hierarchy.[10]
The Visual hierarchy of a map may apply to individual geographic features (such as making a single country stand out), to map layers of related features (e.g., making lakes stand out more than roads), and to the entire layout of map and non-map elements (e.g., making the title look more important than the scale bar). Like the main map elements, such features have weight, and the properties that apply to visual hierarchy of map layers also apply to other elements on the page. Size and alignment are the two main determinants of the visual hierarchy for these features.[11] Cartographers often utilize principles of negative space and figure-ground contrast to design an appropriate visual hierarchy by employing contrast between unused space and layout features.[1]
User experience design and behavioral design edit
In user experience design and behavioural design, such as web design, visual hierarchy is used to prioritize navigational structures and content, so that audiences focus on elements that facilitate system usage, or increases the chance that they notice content that contains psychological nudges. Color is one of many factors used in the design of a visual hierarchy, and a key factor due to the high salience of color perception.[7]
See also edit
References edit
- ^ a b "visual hierarchy". GIS Dictionary. ESRI. Archived from the original on 2016-03-03. Retrieved 2019-09-26.
- ^ Urano, Yoko; Kurosu, Aaron; Henselman-Petrusek, Gregory; Todorov, Alexander (2021). "Visual hierarchy relates to impressions of good design". CHI'21 Workshop on Eye Movements as an Interface to Cognitive State: 1–9. doi:10.31234/osf.io/hksf9. S2CID 236599584.
- ^ Jackson, Ian. “Gestalt—A Learning Theory for Graphic Design Education.” International Journal of Art and Design Education. Volume 27. Issue 1 (2008): 63-69. Digital.
- ^ Pettersson, Rune. “Information Design—Principles and Guidelines.” Journal of Visual Literacy. Volume 29. Issue 2 (2010): 167-182. Digital.
- ^ Feldsted, CJ. Design Fundamentals. New York: Pittman Publishing Corporation, 1950.
- ^ Tait, A. (2018). Visual Hierarchy and Layout. The Geographic Information Science & Technology Body of Knowledge (2nd Quarter 2018 Edition), John P. Wilson (ed.). DOI: 10.22224/gistbok/2018.2.4
- ^ a b Cugelman, B. Cugeman, R. et al. (2019) Color Psychology. AlterSpark. https://www.alterspark.com/color-psychology/visual-hierarchy
- ^ Jeff Gothelf, The Squint Test: How quick exposure to design can reveal its flaws, Usabilla
- ^ Robinson, Arthur H. Elements of Cartography. 6th ed., Wiley, 1995.
- ^ https://www.ordnancesurvey.co.uk/resources/carto-design/clear-visual-hierachy.html. Archived 2017-12-22 at the Wayback Machine
- ^ Slocum, Terry A. Chapter 5 in Thematic Cartography and Geovisualization, Pearson, 2014.