


Summary
WPGMA (Weighted Pair Group Method with Arithmetic Mean) is a simple agglomerative (bottom-up) hierarchical clustering method, generally attributed to Sokal and Michener.[1]
The WPGMA method is similar to its unweighted variant, the UPGMA method.
Algorithm edit
The WPGMA algorithm constructs a rooted tree (dendrogram) that reflects the structure present in a pairwise distance matrix (or a similarity matrix). At each step, the nearest two clusters, say and , are combined into a higher-level cluster . Then, its distance to another cluster is simply the arithmetic mean of the average distances between members of and and and :


The WPGMA algorithm produces rooted dendrograms and requires a constant-rate assumption: it produces an ultrametric tree in which the distances from the root to every branch tip are equal. This ultrametricity assumption is called the molecular clock when the tips involve DNA, RNA and protein data.
Working example edit
This working example is based on a JC69 genetic distance matrix computed from the 5S ribosomal RNA sequence alignment of five bacteria: Bacillus subtilis ( ), Bacillus stearothermophilus ( ), Lactobacillus viridescens ( ), Acholeplasma modicum ( ), and Micrococcus luteus ( ).[2][3]


First step edit
- First clustering
Let us assume that we have five elements and the following matrix of pairwise distances between them :


| a | b | c | d | e | |
|---|---|---|---|---|---|
| a | 0 | 17 | 21 | 31 | 23 |
| b | 17 | 0 | 30 | 34 | 21 |
| c | 21 | 30 | 0 | 28 | 39 |
| d | 31 | 34 | 28 | 0 | 43 |
| e | 23 | 21 | 39 | 43 | 0 |
In this example, is the smallest value of , so we join elements and .

- First branch length estimation
Let denote the node to which and are now connected. Setting ensures that elements and are equidistant from . This corresponds to the expectation of the ultrametricity hypothesis. The branches joining and to then have lengths (see the final dendrogram)


- First distance matrix update
We then proceed to update the initial distance matrix into a new distance matrix (see below), reduced in size by one row and one column because of the clustering of with . Bold values in correspond to the new distances, calculated by averaging distances between each element of the first cluster and each of the remaining elements:


Italicized values in are not affected by the matrix update as they correspond to distances between elements not involved in the first cluster.
Second step edit
- Second clustering
We now reiterate the three previous steps, starting from the new distance matrix :
| (a,b) | c | d | e | |
|---|---|---|---|---|
| (a,b) | 0 | 25.5 | 32.5 | 22 |
| c | 25.5 | 0 | 28 | 39 |
| d | 32.5 | 28 | 0 | 43 |
| e | 22 | 39 | 43 | 0 |
Here, is the smallest value of , so we join cluster and element .

- Second branch length estimation
Let denote the node to which and are now connected. Because of the ultrametricity constraint, the branches joining or to , and to are equal and have the following length:


We deduce the missing branch length: (see the final dendrogram)

- Second distance matrix update
We then proceed to update the matrix into a new distance matrix (see below), reduced in size by one row and one column because of the clustering of with :


Of note, this average calculation of the new distance does not account for the larger size of the cluster (two elements) with respect to (one element). Similarly:

The averaging procedure therefore gives differential weight to the initial distances of matrix . This is the reason why the method is weighted, not with respect to the mathematical procedure but with respect to the initial distances.
Third step edit
- Third clustering
We again reiterate the three previous steps, starting from the updated distance matrix .
| ((a,b),e) | c | d | |
|---|---|---|---|
| ((a,b),e) | 0 | 32.25 | 37.75 |
| c | 32.25 | 0 | 28 |
| d | 37.75 | 28 | 0 |
Here, is the smallest value of , so we join elements and .

- Third branch length estimation
Let denote the node to which and are now connected. The branches joining and to then have lengths (see the final dendrogram)


- Third distance matrix update
There is a single entry to update:

Final step edit
The final matrix is:

| ((a,b),e) | (c,d) | |
|---|---|---|
| ((a,b),e) | 0 | 35 |
| (c,d) | 35 | 0 |
So we join clusters and .


Let denote the (root) node to which and are now connected. The branches joining and to then have lengths:


We deduce the two remaining branch lengths:


The WPGMA dendrogram edit
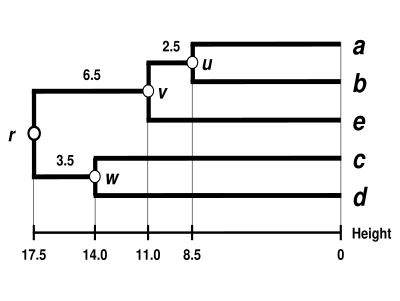
The dendrogram is now complete. It is ultrametric because all tips ( to ) are equidistant from :

The dendrogram is therefore rooted by , its deepest node.
Comparison with other linkages edit
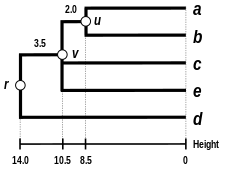
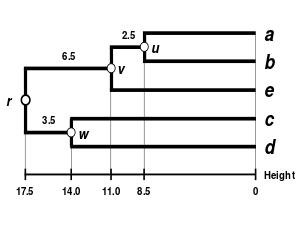
Alternative linkage schemes include single linkage clustering, complete linkage clustering, and UPGMA average linkage clustering. Implementing a different linkage is simply a matter of using a different formula to calculate inter-cluster distances during the distance matrix update steps of the above algorithm. Complete linkage clustering avoids a drawback of the alternative single linkage clustering method - the so-called chaining phenomenon, where clusters formed via single linkage clustering may be forced together due to single elements being close to each other, even though many of the elements in each cluster may be very distant to each other. Complete linkage tends to find compact clusters of approximately equal diameters.[4]
 |

|
 |
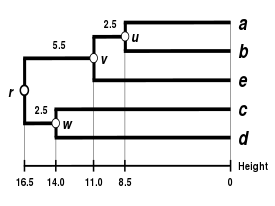 |
| Single-linkage clustering | Complete-linkage clustering | Average linkage clustering: WPGMA. | Average linkage clustering: UPGMA |
See also edit
References edit
- ^ Sokal, Michener (1958). "A statistical method for evaluating systematic relationships". University of Kansas Science Bulletin. 38: 1409–1438.
- ^ Erdmann VA, Wolters J (1986). "Collection of published 5S, 5.8S and 4.5S ribosomal RNA sequences". Nucleic Acids Research. 14 Suppl (Suppl): r1–59. doi:10.1093/nar/14.suppl.r1. PMC 341310. PMID 2422630.
- ^ Olsen GJ (1988). Phylogenetic analysis using ribosomal RNA. Methods in Enzymology. Vol. 164. pp. 793–812. doi:10.1016/s0076-6879(88)64084-5. PMID 3241556.
- ^ Everitt, B. S.; Landau, S.; Leese, M. (2001). Cluster Analysis. 4th Edition. London: Arnold. pp. 62–64.