


Summary
Walsall South is a constituency[n 1] represented in the House of Commons of the UK Parliament since 2010 by Valerie Vaz, a member of the Labour Party.[n 2]
| Walsall South | |
|---|---|
| Borough constituency for the House of Commons | |
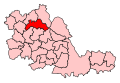 Boundary of Walsall South in West Midlands | |
 Location of West Midlands within England | |
| County | West Midlands |
| Electorate | 66,082 (December 2010)[1] |
| Major settlements | Darlaston and Walsall (part) |
| Current constituency | |
| Created | 1955 |
| Member of Parliament | Valerie Vaz (Labour) |
| Seats | One |
| Created from | Walsall |
The seat is due to be abolished for the next general election.[2]
Members of Parliament edit
| Election | Member[3] | Party | |
|---|---|---|---|
| 1955 | Henry d'Avigdor-Goldsmid | Conservative | |
| Feb 1974 | Bruce George | Labour | |
| 2010 | Valerie Vaz | Labour | |
Constituency profile edit
The constituency is in the heart of an area traditionally focussed on manufacturing, see Walsall, which retains many mechanical and engineering jobs in its economy and this seat has accessible links to the cities of Wolverhampton and Birmingham.
Workless claimants, registered jobseekers, were in November 2012 higher than the national average of 3.8% and regional average of 4.7%, at 7.7% of the population based on a statistical compilation by The Guardian.[4]
Boundaries edit

Walsall South is one of three constituencies in the metropolitan borough and specifically covers Darlaston, Moxley, Pheasey and the southern part of Walsall, including the town centre.
2010–present: The Metropolitan Borough of Walsall wards of Bentley and Darlaston North, Darlaston South, Paddock, Palfrey, Pheasey Park Farm, Pleck, and St Matthew's.
1983–2010: The Metropolitan Borough of Walsall wards of Bentley and Darlaston North, Darlaston South, Paddock, Palfrey, Pheasey, Pleck, and St Matthew's.
1974–1983: The County Borough of Walsall wards of Darlaston North, Darlaston South, Hatherton, Paddock, Palfrey, Pleck, and St Matthew's.
1955–1974: The County Borough of Walsall wards of Bridge, Caldmore, Paddock, Palfrey, and Pleck, and the Urban District of Aldridge.
History edit
The constituency was first contested in 1955 largely from Walsall constituency, and won by its only Conservative MP to date, Major-General Sir Henry d'Avigdor-Goldsmid.
Bruce George of the Labour Party won the seat when the Major-General stood down in the February 1974 general election, he too was a prominent supporter of the armed services and led Britain's NATO delegation to its Parliament, subsequently becoming its vice-president. While never a prominent frontbencher, George held Walsall South until his retirement at the 2010 general election, when he was succeeded by Valerie Vaz (also of the Labour Party).
- Synopsis of results
The Conservative holding of the seat through the First Wilson Ministry reveals that in these early elections the seat was not a bellwether. On the 1974 transfer in power to Wilson again, here the result proved to be a watershed election. Labour's majorities since this, only in fairly good years for the Conservatives, such as during the Thatcher ministry as well as in 1992 and 2010 and 2019 general elections have been marginal.[n 3] In terms of length of a party's representation, Labour has represented this area continuously for a total of 45 years as of 2019.
Proposed abolition edit
Further to the completion of the 2023 Periodic Review of Westminster constituencies, the seat will be abolished for the next general election, with its contents distributed three ways:[2]
- Approximately half the electorate, including Walsall town centre, combined with the majority of Walsall North (also to be abolished) to form the new seat of Walsall and Bloxwich
- Pheasey Park Farm and part of the Paddock ward transferred to Aldridge-Brownhills
- Darlaston and Bentley transferred to Wolverhampton South East
Elections edit
Elections in the 2010s edit
| Party | Candidate | Votes | % | ±% | |
|---|---|---|---|---|---|
| Labour | Valerie Vaz | 20,872 | 49.1 | –8.3 | |
| Conservative | Gurjit Bains | 17,416 | 41.0 | +3.8 | |
| Brexit Party | Gary Hughes | 1,660 | 3.9 | New | |
| Liberal Democrats | Paul Harris | 1,602 | 3.8 | +2.5 | |
| Green | John Macefield | 634 | 1.5 | New | |
| Independent | Akheil Mehboob | 288 | 0.7 | New | |
| Majority | 3,456 | 8.1 | –12.1 | ||
| Turnout | 42,472 | 62.4 | –4.0 | ||
| Labour hold | Swing | –6.1 | |||
| Party | Candidate | Votes | % | ±% | |
|---|---|---|---|---|---|
| Labour | Valerie Vaz | 25,286 | 57.4 | +10.2 | |
| Conservative | James Bird | 16,394 | 37.2 | +4.4 | |
| UKIP | Derek Bennett | 1,805 | 4.1 | –11.5 | |
| Liberal Democrats | Anna Purvis | 587 | 1.3 | –0.3 | |
| Majority | 8,892 | 20.2 | +5.8 | ||
| Turnout | 44,072 | 66.4 | +4.6 | ||
| Labour hold | Swing | +2.9 | |||
| Party | Candidate | Votes | % | ±% | |
|---|---|---|---|---|---|
| Labour | Valerie Vaz | 19,740 | 47.2 | +7.5 | |
| Conservative | Sue Arnold | 13,733 | 32.8 | –2.6 | |
| UKIP | Derek Bennett | 6,540 | 15.6 | +7.2 | |
| Green | Charlotte Fletcher | 1,149 | 2.7 | New | |
| Liberal Democrats | Joel Kenrick | 676 | 1.6 | –12.8 | |
| Majority | 6,007 | 14.4 | +10.1 | ||
| Turnout | 41,838 | 61.8 | –1.3 | ||
| Labour hold | Swing | +5.0 | |||
| Party | Candidate | Votes | % | ±% | |
|---|---|---|---|---|---|
| Labour | Valerie Vaz | 16,211 | 39.7 | –9.5 | |
| Conservative | Richard Hunt | 14,456 | 35.4 | +6.9 | |
| Liberal Democrats | Murli Sinha | 5,880 | 14.4 | +4.6 | |
| UKIP | Derek Bennett | 3,449 | 8.4 | +3.6 | |
| Christian | Gulzaman Khan | 482 | 1.2 | New | |
| Independent | Mohammed Mulia | 404 | 1.0 | New | |
| Majority | 1,755 | 4.3 | –18.2 | ||
| Turnout | 40,882 | 63.1 | +3.1 | ||
| Labour hold | Swing | –8.2 | |||
Elections in the 2000s edit
| Party | Candidate | Votes | % | ±% | |
|---|---|---|---|---|---|
| Labour | Bruce George | 17,633 | 49.9 | –9.1 | |
| Conservative | Kabir Sabar | 9,687 | 27.4 | –3.1 | |
| Liberal Democrats | Mohamed Asmal | 3,240 | 9.2 | +2.4 | |
| UKIP | Derek Bennett | 1,833 | 5.2 | +2.4 | |
| BNP | Kevin Smith | 1,776 | 5.0 | New | |
| Respect | Nadia Fazal | 1,146 | 3.2 | New | |
| Majority | 7,946 | 22.5 | –6.0 | ||
| Turnout | 35,365 | 58.5 | +2.8 | ||
| Labour hold | Swing | –3.0 | |||
| Party | Candidate | Votes | % | ±% | |
|---|---|---|---|---|---|
| Labour | Bruce George | 20,574 | 59.0 | +1.1 | |
| Conservative | Michael Bird | 10,643 | 30.5 | –1.2 | |
| Liberal Democrats | Bill Tomlinson | 2,365 | 6.8 | +0.6 | |
| UKIP | Derek Bennett | 974 | 2.8 | New | |
| Socialist Alliance | Peter Smith | 343 | 1.0 | New | |
| Majority | 9,931 | 28.5 | +2.3 | ||
| Turnout | 34,899 | 55.7 | –11.6 | ||
| Labour hold | Swing | +1.1 | |||
Elections in the 1990s edit
| Party | Candidate | Votes | % | ±% | |
|---|---|---|---|---|---|
| Labour | Bruce George | 25,024 | 57.9 | +9.7 | |
| Conservative | Leslie Leek | 13,712 | 31.7 | –10.2 | |
| Liberal Democrats | Harry Harris | 2,698 | 6.2 | –2.1 | |
| Referendum | Thomas Dent | 1,662 | 3.8 | New | |
| Natural Law | Linda Meads | 149 | 0.4 | +0.1 | |
| Majority | 11,312 | 26.2 | +19.9 | ||
| Turnout | 43,245 | 67.3 | –9.0 | ||
| Labour hold | Swing | +10.0 | |||
| Party | Candidate | Votes | % | ±% | |
|---|---|---|---|---|---|
| Labour | Bruce George | 24,133 | 48.2 | +3.3 | |
| Conservative | LC Jones | 20,955 | 41.9 | –0.8 | |
| Liberal Democrats | GE Williams | 4,132 | 8.3 | –4.1 | |
| Green | RJ Clarke | 673 | 1.3 | New | |
| Natural Law | JD Oldbury | 167 | 0.3 | New | |
| Majority | 3,178 | 6.3 | +4.1 | ||
| Turnout | 50,060 | 76.3 | +0.8 | ||
| Labour hold | Swing | +2.1 | |||
Elections in the 1980s edit
| Party | Candidate | Votes | % | ±% | |
|---|---|---|---|---|---|
| Labour | Bruce George | 22,629 | 44.9 | +1.4 | |
| Conservative | Graham Postles | 21,513 | 42.7 | +0.6 | |
| Liberal | Lionel King | 6,241 | 12.4 | -0.8 | |
| Majority | 1,116 | 2.2 | +0.8 | ||
| Turnout | 50,383 | 75.5 | +1.2 | ||
| Labour hold | Swing | +1.0 | |||
| Party | Candidate | Votes | % | ±% | |
|---|---|---|---|---|---|
| Labour | Bruce George | 21,735 | 43.5 | -7.4 | |
| Conservative | David Nicholson | 21,033 | 42.1 | -5.2 | |
| Liberal | Bernard Silver[19] | 6,586 | 13.2 | New | |
| BNP | J Parker | 632 | 1.3 | New | |
| Majority | 702 | 1.4 | -2.2 | ||
| Turnout | 49,986 | 74.3 | -2.4 | ||
| Labour hold | Swing | -1.1 | |||
Elections in the 1970s edit
| Party | Candidate | Votes | % | ±% | |
|---|---|---|---|---|---|
| Labour | Bruce George | 22,539 | 50.9 | +2.9 | |
| Conservative | A Hill | 20,951 | 47.3 | +10.0 | |
| National Front | V Parker | 795 | 1.80 | -1.0 | |
| Majority | 1,588 | 3.6 | -7.1 | ||
| Turnout | 44,285 | 76.7 | +3.1 | ||
| Labour hold | Swing | ||||
| Party | Candidate | Votes | % | ±% | |
|---|---|---|---|---|---|
| Labour | Bruce George | 20,917 | 48.0 | +2.8 | |
| Conservative | H Smith | 16,255 | 37.3 | -4.4 | |
| Liberal | GFA Hooper | 5,031 | 11.5 | -1.6 | |
| National Front | JC Parker | 1,226 | 2.8 | New | |
| More Prosperous Britain | Tom Keen | 150 | 0.34 | New | |
| Majority | 4,662 | 10.7 | +7.2 | ||
| Turnout | 43,579 | 73.6 | -4.7 | ||
| Labour hold | Swing | ||||
| Party | Candidate | Votes | % | ±% | |
|---|---|---|---|---|---|
| Labour | Bruce George | 20,775 | 45.2 | ||
| Conservative | H Smith | 19,195 | 41.7 | ||
| Liberal | Richard Hains | 6,038 | 13.1 | ||
| Majority | 1,580 | 3.5 | N/A | ||
| Turnout | 46,008 | 78.3 | |||
| Labour gain from Conservative | Swing | ||||
| Party | Candidate | Votes | % | ±% | |
|---|---|---|---|---|---|
| Conservative | Henry d'Avigdor-Goldsmid | 35,545 | 59.5 | +6.1 | |
| Labour | Graham S Rea | 24,196 | 40.5 | -6.1 | |
| Majority | 11,349 | 19.0 | +12.1 | ||
| Turnout | 59,741 | 73.0 | -4.2 | ||
| Conservative hold | Swing | ||||
Elections in the 1960s edit
| Party | Candidate | Votes | % | ±% | |
|---|---|---|---|---|---|
| Conservative | Henry d'Avigdor-Goldsmid | 30,161 | 53.4 | -3.7 | |
| Labour | R Geoffrey Drake | 26,280 | 46.6 | +3.7 | |
| Majority | 3,881 | 6.9 | -7.3 | ||
| Turnout | 56,441 | 77.2 | -1.9 | ||
| Conservative hold | Swing | ||||
| Party | Candidate | Votes | % | ±% | |
|---|---|---|---|---|---|
| Conservative | Henry d'Avigdor-Goldsmid | 32,602 | 57.1 | -1.3 | |
| Labour | Bryan Stanley | 24,532 | 42.9 | +1.3 | |
| Majority | 8,070 | 14.2 | -2.6 | ||
| Turnout | 57,314 | 79.1 | -4.0 | ||
| Conservative hold | Swing | ||||
Elections in the 1950s edit
| Party | Candidate | Votes | % | ±% | |
|---|---|---|---|---|---|
| Conservative | Henry d'Avigdor-Goldsmid | 30,471 | 58.4 | +5.7 | |
| Labour | John AF Ennals | 21,689 | 41.6 | -5.8 | |
| Majority | 8,782 | 16.8 | +11.5 | ||
| Turnout | 52,160 | 83.1 | +2.9 | ||
| Conservative hold | Swing | ||||
| Party | Candidate | Votes | % | ±% | |
|---|---|---|---|---|---|
| Conservative | Henry d'Avigdor-Goldsmid | 24,077 | 52.7 | ||
| Labour | John Ennals | 21,651 | 47.4 | ||
| Majority | 2,426 | 5.3 | |||
| Turnout | 45,728 | 80.2 | |||
| Conservative win (new seat) | |||||
See also edit
Notes edit
- ^ A borough constituency (for the purposes of election expenses and type of returning officer)
- ^ As with all constituencies, the constituency elects one Member of Parliament (MP) by the first past the post system of election at least every five years.
- ^ 6.3% and 4.3% of the vote respectively in the specific election years given.
References edit
- ^ "Electorate Figures – Boundary Commission for England". 2011 Electorate Figures. Boundary Commission for England. 4 March 2011. Retrieved 13 March 2011.
- ^ a b "The 2023 Review of Parliamentary Constituency Boundaries in England – Volume one: Report – West Midlands | Boundary Commission for England". boundarycommissionforengland.independent.gov.uk. Retrieved 22 July 2023.
- ^ Leigh Rayment's Historical List of MPs – Constituencies beginning with "W" (part 1)
- ^ Unemployment claimants by constituency The Guardian
- ^ "Walsall South Parliamentary constituency". BBC News. BBC. Retrieved 1 December 2019.
- ^ "Walsall South Parliamentary constituency". BBC Online. Archived from the original on 8 August 2017.
- ^ "Election Data 2015". Electoral Calculus. Archived from the original on 17 October 2015. Retrieved 17 October 2015.
- ^ "Election Data 2010". Electoral Calculus. Archived from the original on 26 July 2013. Retrieved 17 October 2015.
- ^ "BBC NEWS – Election 2010 – Walsall South". BBC News.
- ^ "Election Data 2005". Electoral Calculus. Archived from the original on 15 October 2011. Retrieved 18 October 2015.
- ^ "Election Data 2001". Electoral Calculus. Archived from the original on 15 October 2011. Retrieved 18 October 2015.
- ^ "Vote 2001 Results & Constituencies Walsall South". BBC. Retrieved 30 June 2017.
- ^ "Election Data 1997". Electoral Calculus. Archived from the original on 15 October 2011. Retrieved 18 October 2015.
- ^ "Election Data 1992". Electoral Calculus. Archived from the original on 15 October 2011. Retrieved 18 October 2015.
- ^ "Politics Resources". Election 1992. Politics Resources. 9 April 1992. Retrieved 6 December 2010.
- ^ "Election Data 1987". Electoral Calculus. Archived from the original on 15 October 2011. Retrieved 18 October 2015.
- ^ "Election Data 1983". Electoral Calculus. Archived from the original on 15 October 2011. Retrieved 18 October 2015.
- ^ "Election '83 Full Results". The Guardian. 11 June 1983. p. 18. Retrieved 24 October 2021. – via newspapers.com (subscription required)
- ^ "Liberal / Liberal Democrat Candidates in Parliamentary Elections in the West Midland Region 1945-2015" (PDF). liberalhistory.org.uk. Archived from the original (PDF) on 24 October 2021. Retrieved 24 October 2021.
52°34′N 1°59′W / 52.57°N 1.98°W