


Summary
The Washington State Democratic Party is the affiliate of the Democratic Party in the U.S. state of Washington, headquartered in Seattle.[1] It is also commonly referred to as the Washington State Democrats and the Washington Democratic Party. It is currently the dominant party in the state, controlling the majority of Washington's U.S. House seats, both U.S. Senate seats, both houses of the state legislature, and the governorship.
Democratic Party of the State of Washington | |
|---|---|
| General Secretary | Shasti Conrad |
| Founded | 1890 |
| Headquarters | 615 2nd Ave., Suite 580 Seattle, WA 98104 |
| Ideology | Social liberalism Modern liberalism Progressivism |
| Political position | Center-left |
| National affiliation | Democratic Party |
| Colors | Blue |
| Washington State Senate | 29 / 49 |
| Washington House of Representatives | 58 / 98 |
| U.S. Senate Seats | 2 / 2 |
| U.S. House Seats | 8 / 10 |
| Statewide Executive Offices | 9 / 9 |
| Website | |
| Official website | |
Organization edit
Washington State Democratic Central Committee (WSDCC) edit
- Chair: Shasti Conrad
- Vice-Chair: David Green
- Treasurer: David Kim
- Secretary: Rob Dolin
County party organizations edit
Each of Washington's 39 counties has a county democratic central committee, which operates within that county and sends two delegates (which may not share the same gender identity) to the State Central Committee.
Legislative district organizations edit
Each of Washington's 49 legislative districts has a local Democratic party organization, which operates within that district and sends two delegates (which may not share the same gender identity) to the State Central Committee.
Other state organizations edit
Washington state has organizations such as the High School Democrats of Washington, the College Democrats of Washington, and the Young Democrats of Washington, separate from the State Central Committee.
Current elected officials edit
The following popularly-elected offices are held by Democrats:
U.S. Senate edit
Since 2001, Democrats have controlled both of Washington's seats in the Senate:
-
 Junior U.S. Senator Maria Cantwell
 -
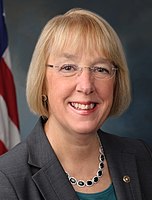 Senior U.S. Senator Patty Murray


U.S. House of Representatives edit
Democrats control a majority; they hold eight of the state's ten seats in the House following the 2020 census:
| District | Member | Photo |
|---|---|---|
| 1st | Suzan DelBene |  |
| 2nd | Rick Larsen |  |
| 3rd | Marie Gluesenkamp Perez |  |
| 6th | Derek Kilmer | 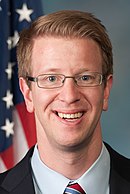 |
| 7th | Pramila Jayapal |  |
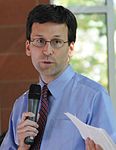
| 8th | Kim Schrier |  |
| 9th | Adam Smith |  |
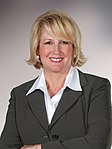
| 10th | Marilyn Strickland |  |
Statewide officeholders edit
Democrats hold all nine of Washington's constitutional offices.[a][2]


Legislative leadership edit
- Senate president pro tempore: Karen Keiser
- Senate majority leader: Andy Billig
- Speaker of the House: Laurie Jinkins
- Speaker pro tempore of the House: Tina Orwall
- House majority leader: Pat Sullivan
Election results edit
Presidential edit
Senatorial edit
| Election | Senatorial candidate | Votes | Vote % | Result |
|---|---|---|---|---|
| 1914 | William W. Black | 91,733 | 26.57% | Lost |
| 1916 | George Turner | 135,339 | 37.06% | Lost |
| 1920 | George F. Cotterill | 68,488 | 17.80% | Lost |
| 1922 | Clarence Dill | 130,347 | 44.27% | Won |
| 1926 | A. Scott Bullitt | 148,783 | 46.51% | Lost |
| 1928 | Clarence Dill | 261,524 | 53.42% | Won |
| 1932 | Homer Bone | 365,939 | 60.61% | Won |
| 1934 | Lewis Schwellenbach | 302,606 | 60.93% | Won |
| 1938 | Homer Bone | 371,535 | 62.62% | Won |
| 1940 | Monrad Wallgren | 404,718 | 54.16% | Won |
| 1944 | Warren Magnuson | 452,013 | 55.13% | Won |
| 1946 | Hugh Mitchell | 298,683 | 45.23% | Lost |
| 1950 | Warren Magnuson | 397,719 | 53.40% | Won |
| 1952 | Henry M. Jackson | 595,288 | 56.23% | Won |
| 1956 | Warren Magnuson | 685,565 | 61.09% | Won |
| 1958 | Henry M. Jackson | 597,040 | 67.32% | Won |
| 1962 | Warren Magnuson | 491,365 | 52.09% | Won |
| 1964 | Henry M. Jackson | 875,950 | 72.21% | Won |
| 1968 | Warren Magnuson | 796,183 | 64.41% | Won |
| 1970 | Henry M. Jackson | 879,385 | 82.43% | Won |
| 1974 | Warren Magnuson | 611,811 | 60.70% | Won |
| 1976 | Henry M. Jackson | 1,071,219 | 71.84% | Won |
| 1980 | Warren Magnuson | 792,052 | 45.83% | Lost |
| 1982 | Henry M. Jackson | 943,665 | 68.96% | Won |
| 1983 (special) | Mike Lowry | 540,981 | 44.59% | Lost |
| 1986 | Brock Adams | 677,471 | 50.66% | Won |
| 1988 | Mike Lowry | 904,183 | 48.91% | Lost |
| 1992 | Patty Murray | 1,197,973 | 53.99% | Won |
| 1994 | Ron Sims | 752,352 | 44.25% | Lost |
| 1998 | Patty Murray | 1,103,184 | 58.41% | Won |
| 2000 | Maria Cantwell | 1,199,437 | 48.73% | Won |
| 2004 | Patty Murray | 1,549,708 | 54.98% | Won |
| 2006 | Maria Cantwell | 1,184,659 | 56.81% | Won |
| 2010 | Patty Murray | 1,314,930 | 52.08% | Won |
| 2012 | Maria Cantwell | 1,855,493 | 60.36% | Won |
| 2016 | Patty Murray | 1,913,979 | 58.83% | Won |
| 2018 | Maria Cantwell | 1,803,364 | 58.31% | Won |
| 2022 | Patty Murray | 1,741,827 | 57.15% | Won |
Gubernatorial edit
| Election | Gubernatorial candidate | Votes | Vote % | Result |
|---|---|---|---|---|
| 1889 | Eugene Semple | 24,732 | 42.32% | Lost |
| 1892 | Henry J. Snively | 28,960 | 32.20% | Lost |
| 1896 | John Rankin Rogers | 50,849 | 55.55% | Won |
| 1900 | John Rankin Rogers | 52,048 | 48.86% | Won |
| 1904 | George Turner | 59,119 | 40.87% | Lost |
| 1908 | John Pattison | 58,126 | 33.00% | Lost |
| 1912 | Ernest Lister | 97,251 | 30.55% | Won |
| 1916 | Ernest Lister | 181,645 | 48.10% | Won |
| 1920 | William Wilson Black | 66,079 | 16.39% | Lost |
| 1924 | Ben F. Hill | 126,447 | 32.40% | Lost |
| 1928 | A. Scott Bullitt | 214,334 | 42.73% | Lost |
| 1932 | Clarence D. Martin | 352,215 | 57.29% | Won |
| 1936 | Clarence D. Martin | 466,550 | 69.36% | Won |
| 1940 | Clarence Dill | 386,706 | 49.49% | Lost |
| 1944 | Monrad Wallgren | 428,834 | 51.51% | Won |
| 1948 | Monrad Wallgren | 417,035 | 47.22% | Lost |
| 1952 | Hugh Mitchell | 510,675 | 47.35% | Lost |
| 1956 | Albert Rosellini | 616,773 | 54.63% | Won |
| 1960 | Albert Rosellini | 611,987 | 50.34% | Won |
| 1964 | Albert Rosellini | 548,692 | 43.89% | Lost |
| 1968 | John J. O'Connell | 560,262 | 44.28% | Lost |
| 1972 | Albert Rosellini | 630,613 | 42.82% | Lost |
| 1976 | Dixy Lee Ray | 821,797 | 53.14% | Won |
| 1980 | Jim McDermott | 749,813 | 43.32% | Lost |
| 1984 | Booth Gardner | 1,006,993 | 53.31% | Won |
| 1988 | Booth Gardner | 1,166,448 | 62.21% | Won |
| 1992 | Mike Lowry | 1,184,315 | 52.16% | Won |
| 1996 | Gary Locke | 1,296,492 | 57.96% | Won |
| 2000 | Gary Locke | 1,441,973 | 58.38% | Won |
| 2004 | Christine Gregoire | 1,373,361 | 48.87% | Won |
| 2008 | Christine Gregoire | 1,598,738 | 53.00% | Won |
| 2012 | Jay Inslee | 1,582,802 | 51.40% | Won |
| 2016 | Jay Inslee | 1,760,520 | 54.25% | Won |
| 2020 | Jay Inslee | 2,294,243 | 56.56% | Won |
See also edit
Notes edit
- ^ The Washington State Office of Superintendent of Public Instruction is officially nonpartisan, but Superintendent Reykdal identifies with the Democratic Party.
References edit
External links edit
- Washington State Democratic Party
- 2012 Washington State Democratic Party Platform