


Summary
51°15′36″N 2°11′10″W / 51.260°N 2.186°W
| Westbury | |
|---|---|
| Former County constituency for the House of Commons | |
 Boundary of Westbury in Wiltshire for the 2005 general election | |
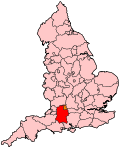 Location of Wiltshire within England | |
| County | Wiltshire |
| Major settlements | Westbury |
| 1449–2010 | |
| Seats | One (Two 1449–1832) |
| Replaced by | South West Wiltshire, Chippenham |
Westbury was a parliamentary constituency in Wiltshire from 1449 to 2010. It was represented in the House of Commons of England until 1707, and then in the House of Commons of Great Britain from 1707 to 1800, and finally in the House of Commons of the Parliament of the United Kingdom from 1801 until 2010.
Until 1885, it was a parliamentary borough, returning two Members of Parliament (MPs) until 1832 and only one from 1832 to 1885. The parliamentary borough was abolished in 1885, when the name was transferred to a county constituency returning one MP. Elections used the bloc vote system when two MPs were returned, and the first-past-the-post system of election when one seat was contested.
Westbury returned a Conservative Member at every election after 1924.
Boundaries edit
1885–1918: The Sessional Divisions of Bradford-on-Avon, Melksham, Trowbridge, Westbury, and Whorwellsdon, and part of the Sessional Division of Warminster.
1918–1950: The Urban Districts of Bradford-on-Avon, Melksham, Trowbridge, Warminster, and Westbury, and the Rural Districts of Bradford-on-Avon, Melksham, Mere, Warminster, and Westbury and Whorwellsdown.
1950–1974: The Urban Districts of Bradford-on-Avon, Melksham, Trowbridge, Warminster, and Westbury, and the Rural Districts of Bradford-on-Avon and Melksham, Mere and Tisbury, and Warminster and Westbury.
1974–1983: As prior but with redrawn boundaries.
1983–1997: The District of West Wiltshire, and the District of Salisbury wards of Knoyle, Mere, and Western.
1997–2010: The District of West Wiltshire wards of Adcroft, Bradford-on-Avon North, Bradford-on-Avon South, college, Corsley, Dilton Marsh, Drynham, Ethandune, Holt, John O'Gaunt, Manor Vale, Mid Wylye Valley, Park, Paxcroft, Shearwater, Summerham, Warminster East, Warminster West, Weavers, Westbrook, Westbury with Storridge, and Wylye Valley, and the District of Salisbury wards of Knoyle, Mere, and Western.
Originally a small pocket borough, covering only a small part of the parish of Westbury, in 1885 the parliamentary borough became a county constituency in Wiltshire. At the time of the constituency's abolition in 2010 it included the towns of Westbury, Warminster, Trowbridge, and Bradford-on-Avon, and the surrounding rural areas as far south as Mere. Until boundary changes in 1997, it also included Melksham.
Boundary review, 2005 edit
Following a review of parliamentary representation in Wiltshire, the Boundary Commission for England created two new constituencies in the county. Chippenham was created mostly from the adjoining North Wiltshire constituency, plus the town of Bradford-on-Avon at the northern end of the Westbury constituency, while the rest of Westbury saw minor changes to its composition and was renamed South West Wiltshire. These changes were approved in 2005, to take effect at the following general election, which ultimately took place in 2010.
Members of Parliament edit
Westbury borough (before 1885) edit
MPs 1449–1640 edit
This list is incomplete; you can help by adding missing items. (August 2008) |
| Parliament | First member | Second member |
|---|---|---|
| 1491 | Sir Thomas Long of Draycot | |
| 1510-1523 | No names known [1] | |
| 1529 | Thomas Kirton | Thomas Temys[1] |
| 1536 | ? | |
| 1539 | ? | |
| 1542 | ? | |
| 1545 | William Hartgill | Geoffrey Carter[1] |
| 1547 | John Stokes | Kenelm Throckmorton[1] |
| 1553 (Mar) | ? | |
| 1553 (Oct) | Andrew Baynton | Griffin Curteys[1] |
| 1554 (Apr) | Griffin Curteys | Peter Morgan[1] |
| 1554 (Nov) | William Bennett | Griffin Curteys[1] |
| 1555 | Sir Thomas Throckmorton | William Hoskins[1] |
| 1558 | John Buckland | William Allen Helyer[1] |
| 1559 | Anthony Carleton | Ralph Skinner[2] |
| 1562–3 | Hugh Ryley | John Dyster[2] |
| 1571 | Francis Blount | Thomas Long[2] |
| 1572 | William Brouncker | Henry Brouncker[2] |
| 1584 | Edward Midwinter[2] | |
| 1586 | Robert Baynard | Henry Whitaker[2] |
| 1588 | Sir Henry Fanshawe | John Bennett[2] |
| 1593 | William Jordyn | Sir Henry Fanshawe[2] |
| 1597 | Matthew Ley | James Ley[2][3] |
| 1601 | Henry Jackman[2] | |
| 1604 | James Ley | |
| 1605 | Alexander Chocke | |
| 1609 | James Ley | |
| 1614 | Henry Ley | |
| 1621 | Sir James Ley replaced by Walter Long |
Sir Miles Fleetwood |
| 1624 | Sir Henry Ley | Sir Henry Mildmay |
| 1625 | Sir Walter Long | Gifford Long |
| 1626 | Thomas Hopton | |
| 1628 | Maximilian Petty | Charles Thynne |
| 1629–1640 | No Parliaments summoned | |
MPs 1640–1832 edit
MPs 1832–1885 edit
| Election | Member | Party | |
|---|---|---|---|
| 1832 | Sir Ralph Lopes | Whig[15] | |
| 1837 | John Ivatt Briscoe | Whig[15][16][17][18][19] | |
| 1841 | Sir Ralph Lopes | Conservative[15] | |
| 1847 | James Wilson | Whig[20][21][22] | |
| 1857 | Sir Massey Lopes | Conservative | |
| 1868 | John Lewis Phipps[23] | Conservative | |
| 1869 by-election | Charles Paul Phipps | Conservative | |
| 1874 | Abraham Laverton | Liberal | |
| 1880 | Charles N. P. Phipps | Conservative | |
| 1885 | Borough abolished - named transferred to county division | ||
Westbury County constituency (1885–2010) edit
Elections edit
Elections in the 1830s edit
| Party | Candidate | Votes | % | ||
|---|---|---|---|---|---|
| Tory | Alexander Grant | Unopposed | |||
| Tory | Michael Prendergast | Unopposed | |||
| Tory hold | |||||
| Tory hold | |||||
| Party | Candidate | Votes | % | ||
|---|---|---|---|---|---|
| Tory | Henry Hanmer | Unopposed | |||
| Whig | Ralph Lopes | Unopposed | |||
| Tory hold | |||||
| Whig gain from Tory | |||||
Hanmer resigned, causing a by-election.
| Party | Candidate | Votes | % | ||
|---|---|---|---|---|---|
| Whig | Henry Frederick Stephenson (MP) | Unopposed | |||
| Whig gain from Tory | |||||
| Party | Candidate | Votes | % | ||
|---|---|---|---|---|---|
| Whig | Ralph Lopes | Unopposed | |||
| Registered electors | 185 | ||||
| Whig hold | |||||
| Party | Candidate | Votes | % | ||
|---|---|---|---|---|---|
| Whig | Ralph Lopes | Unopposed | |||
| Registered electors | 192 | ||||
| Whig hold | |||||
| Party | Candidate | Votes | % | ||
|---|---|---|---|---|---|
| Whig | John Ivatt Briscoe | 98 | 50.5 | ||
| Conservative | Ralph Lopes | 96 | 49.5 | ||
| Majority | 2 | 1.0 | |||
| Turnout | 194 | 91.1 | |||
| Registered electors | 213 | ||||
| Whig hold | |||||
Elections in the 1840s edit
| Party | Candidate | Votes | % | ±% | |
|---|---|---|---|---|---|
| Conservative | Ralph Lopes | Unopposed | |||
| Registered electors | 291 | ||||
| Conservative gain from Whig | |||||
| Party | Candidate | Votes | % | ±% | |
|---|---|---|---|---|---|
| Whig | James Wilson | 170 | 53.3 | New | |
| Conservative | Matthew Higgins[27] | 149 | 46.7 | N/A | |
| Majority | 21 | 6.6 | N/A | ||
| Turnout | 319 | 93.3 | N/A | ||
| Registered electors | 342 | ||||
| Whig gain from Conservative | Swing | N/A | |||
Elections in the 1850s edit
| Party | Candidate | Votes | % | ±% | |
|---|---|---|---|---|---|
| Whig | James Wilson | 145 | 51.2 | −2.1 | |
| Conservative | Massey Lopes | 138 | 48.8 | +2.1 | |
| Majority | 7 | 2.4 | −4.2 | ||
| Turnout | 283 | 90.1 | −3.2 | ||
| Registered electors | 314 | ||||
| Whig hold | Swing | −2.1 | |||
| Party | Candidate | Votes | % | ±% | |
|---|---|---|---|---|---|
| Conservative | Massey Lopes | Unopposed | |||
| Registered electors | 342 | ||||
| Conservative gain from Whig | |||||
| Party | Candidate | Votes | % | ±% | |
|---|---|---|---|---|---|
| Conservative | Massey Lopes | Unopposed | |||
| Registered electors | 328 | ||||
| Conservative hold | |||||
Elections in the 1860s edit
| Party | Candidate | Votes | % | ±% | |
|---|---|---|---|---|---|
| Conservative | Massey Lopes | Unopposed | |||
| Registered electors | 300 | ||||
| Conservative hold | |||||
| Party | Candidate | Votes | % | ±% | |
|---|---|---|---|---|---|
| Conservative | John Lewis Phipps | 492 | 51.4 | N/A | |
| Liberal | Abraham Laverton | 465 | 48.6 | New | |
| Majority | 27 | 2.8 | N/A | ||
| Turnout | 957 | 91.5 | N/A | ||
| Registered electors | 1,046 | ||||
| Conservative hold | Swing | N/A | |||
The 1868 election was declared void on petition, due to intimidation of the electorate, causing a by-election.[28]
| Party | Candidate | Votes | % | ±% | |
|---|---|---|---|---|---|
| Conservative | Charles Paul Phipps | 499 | 50.6 | −0.8 | |
| Liberal | Abraham Laverton | 488 | 49.4 | +0.8 | |
| Majority | 11 | 1.2 | −1.6 | ||
| Turnout | 987 | 94.4 | +2.9 | ||
| Registered electors | 1,046 | ||||
| Conservative hold | Swing | −0.8 | |||
Elections in the 1870s edit
| Party | Candidate | Votes | % | ±% | |
|---|---|---|---|---|---|
| Liberal | Abraham Laverton | 540 | 51.0 | +2.4 | |
| Conservative | Charles Paul Phipps | 518 | 49.0 | −2.4 | |
| Majority | 22 | 2.0 | N/A | ||
| Turnout | 1,058 | 94.2 | +2.7 | ||
| Registered electors | 1,123 | ||||
| Liberal gain from Conservative | Swing | +2.4 | |||
Elections in the 1880s edit
| Party | Candidate | Votes | % | ±% | |
|---|---|---|---|---|---|
| Conservative | Charles N. P. Phipps | 559 | 52.5 | +3.5 | |
| Liberal | Abraham Laverton | 505 | 47.5 | −3.5 | |
| Majority | 54 | 5.0 | N/A | ||
| Turnout | 1,064 | 94.6 | +0.4 | ||
| Registered electors | 1,125 | ||||
| Conservative gain from Liberal | Swing | +3.5 | |||
| Party | Candidate | Votes | % | ±% | |
|---|---|---|---|---|---|
| Liberal | George Fuller | 5,333 | 59.4 | +11.9 | |
| Conservative | Henry Thynne | 3,639 | 40.6 | −11.9 | |
| Majority | 1,694 | 18.8 | N/A | ||
| Turnout | 8,972 | 84.9 | −9.7 | ||
| Registered electors | 10,566 | ||||
| Liberal gain from Conservative | Swing | +11.9 | |||
| Party | Candidate | Votes | % | ±% | |
|---|---|---|---|---|---|
| Liberal | George Fuller | 4,663 | 56.0 | −3.4 | |
| Liberal Unionist | Thomas George Palmer Hallett[30] | 3,670 | 44.0 | +3.4 | |
| Majority | 993 | 12.0 | −6.8 | ||
| Turnout | 8,333 | 78.9 | −6.0 | ||
| Registered electors | 10,566 | ||||
| Liberal hold | Swing | −3.4 | |||
Elections in the 1890s edit
| Party | Candidate | Votes | % | ±% | |
|---|---|---|---|---|---|
| Liberal | George Fuller | 4,554 | 53.7 | −2.3 | |
| Conservative | William Henry Laverton | 3,930 | 46.3 | +2.3 | |
| Majority | 624 | 7.4 | −4.6 | ||
| Turnout | 8,484 | 77.2 | −1.7 | ||
| Registered electors | 10,989 | ||||
| Liberal hold | Swing | −2.3 | |||
| Party | Candidate | Votes | % | ±% | |
|---|---|---|---|---|---|
| Conservative | Richard Chaloner | 4,497 | 50.9 | +4.6 | |
| Liberal | George Fuller | 4,331 | 49.1 | -4.6 | |
| Majority | 166 | 1.8 | N/A | ||
| Turnout | 8,828 | 90.3 | +13.1 | ||
| Registered electors | 9,777 | ||||
| Conservative gain from Liberal | Swing | +4.6 | |||
Elections in the 1900s edit
| Party | Candidate | Votes | % | ±% | |
|---|---|---|---|---|---|
| Liberal | John Fuller | 4,520 | 53.3 | +4.2 | |
| Conservative | Richard Chaloner | 3,961 | 46.7 | −4.2 | |
| Majority | 559 | 6.6 | N/A | ||
| Turnout | 8,481 | 86.7 | −3.6 | ||
| Registered electors | 9,782 | ||||
| Liberal gain from Conservative | Swing | +4.2 | |||
| Party | Candidate | Votes | % | ±% | |
|---|---|---|---|---|---|
| Liberal | John Fuller | 5,264 | 58.2 | +4.9 | |
| Conservative | Edward Plunkett, Lord Dunsany | 3,788 | 41.8 | -4.9 | |
| Majority | 1,476 | 16.4 | +9.8 | ||
| Turnout | 9,052 | 89.4 | +2.7 | ||
| Registered electors | 10,130 | ||||
| Liberal hold | Swing | +4.9 | |||
| Party | Candidate | Votes | % | ±% | |
|---|---|---|---|---|---|
| Liberal | John Fuller | Unopposed | |||
| Liberal hold | |||||
Elections in the 1910s edit
| Party | Candidate | Votes | % | ±% | |
|---|---|---|---|---|---|
| Liberal | John Fuller | 5,187 | 53.9 | −4.3 | |
| Conservative | R. C. C. Long | 4,433 | 46.1 | +4.3 | |
| Majority | 754 | 7.8 | −8.6 | ||
| Turnout | 9,620 | 92.4 | +3.0 | ||
| Registered electors | 10,411 | ||||
| Liberal hold | Swing | −4.3 | |||
| Party | Candidate | Votes | % | ±% | |
|---|---|---|---|---|---|
| Liberal | John Fuller | 5,041 | 54.8 | +0.9 | |
| Conservative | George Palmer | 4,152 | 45.2 | −0.9 | |
| Majority | 889 | 9.6 | +1.8 | ||
| Turnout | 9,193 | 88.3 | −4.1 | ||
| Registered electors | 10,411 | ||||
| Liberal hold | Swing | +0.9 | |||
| Party | Candidate | Votes | % | ±% | |
|---|---|---|---|---|---|
| Liberal | Geoffrey Howard | 5,073 | 53.0 | −1.8 | |
| Conservative | George Palmer | 4,492 | 47.0 | +1.8 | |
| Majority | 581 | 6.0 | −3.6 | ||
| Turnout | 9,565 | 90.1 | +1.8 | ||
| Registered electors | 10,612 | ||||
| Liberal hold | Swing | −1.8 | |||
General Election 1914–15
Another General Election was required to take place before the end of 1915. The political parties had been making preparations for an election to take place and by July 1914, the following candidates had been selected;
- Liberal Party: Geoffrey Howard
- Unionist Party:George Palmer
| Party | Candidate | Votes | % | ±% | |
|---|---|---|---|---|---|
| C | Unionist | George Palmer | 9,261 | 49.1 | +3.9 |
| Liberal | Geoffrey Howard | 6,064 | 32.1 | −22.7 | |
| Labour | Ernest Bennett | 3,537 | 18.8 | New | |
| Majority | 3,197 | 17.0 | N/A | ||
| Turnout | 18,862 | 64.6 | −23.7 | ||
| Unionist gain from Liberal | Swing | +13.3 | |||
| C indicates candidate endorsed by the coalition government. | |||||
Elections in the 1920s edit

| Party | Candidate | Votes | % | ±% | |
|---|---|---|---|---|---|
| Liberal | Charles Darbishire | 9,903 | 41.7 | +9.6 | |
| Unionist | George Palmer | 9,262 | 39.0 | -10.1 | |
| Labour | George Ward | 4,572 | 19.3 | +0.5 | |
| Majority | 641 | 2.7 | N/A | ||
| Turnout | 23,737 | 81.0 | +16.4 | ||
| Liberal gain from Unionist | Swing | ||||
| Party | Candidate | Votes | % | ±% | |
|---|---|---|---|---|---|
| Liberal | Charles Darbishire | 10,867 | 43.2 | +1.5 | |
| Unionist | Walter William Shaw | 9,891 | 39.4 | +0.4 | |
| Labour | George Ward | 4,372 | 17.4 | -1.9 | |
| Majority | 976 | 3.8 | +1.1 | ||
| Turnout | 25,130 | 83.5 | +2.5 | ||
| Liberal hold | Swing | +0.6 | |||
| Party | Candidate | Votes | % | ±% | |
|---|---|---|---|---|---|
| Unionist | Walter William Shaw | 11,559 | 44.2 | +4.8 | |
| Liberal | Charles Darbishire | 9,848 | 37.7 | -5.5 | |
| Labour | George Ward | 4,731 | 18.1 | +0.7 | |
| Majority | 1,711 | 6.5 | N/A | ||
| Turnout | 26,138 | 84.9 | +1.4 | ||
| Unionist gain from Liberal | Swing | ||||
| Party | Candidate | Votes | % | ±% | |
|---|---|---|---|---|---|
| Unionist | Richard Long | 10,623 | 40.1 | -4.1 | |
| Liberal | Harcourt Johnstone | 10,474 | 39.5 | +1.8 | |
| Labour | George Ward | 5,396 | 20.4 | +2.3 | |
| Majority | 149 | 0.6 | -5.9 | ||
| Turnout | 26,493 | 84.6 | -0.3 | ||
| Unionist hold | Swing | ||||
| Party | Candidate | Votes | % | ±% | |
|---|---|---|---|---|---|
| Unionist | Richard Long | 12,907 | 38.8 | -1.3 | |
| Liberal | Harcourt Johnstone | 12,840 | 38.7 | -0.8 | |
| Labour | George Ward | 7,458 | 22.5 | +2.1 | |
| Majority | 67 | 0.1 | -0.5 | ||
| Turnout | 33,205 | 87.1 | +2.5 | ||
| Unionist hold | Swing | -0.3 | |||
Elections in the 1930s edit
| Party | Candidate | Votes | % | ±% | |
|---|---|---|---|---|---|
| Conservative | Robert Grimston | 16,949 | 51.2 | +12.4 | |
| Liberal | John Hobbis Harris | 11,014 | 33.3 | -5.4 | |
| Labour | Maurice Hackett | 5,127 | 15.5 | -7.0 | |
| Majority | 5,935 | 17.9 | +17.8 | ||
| Turnout | 33,090 | 85.4 | -1.7 | ||
| Conservative hold | Swing | +8.9 | |||
| Party | Candidate | Votes | % | ±% | |
|---|---|---|---|---|---|
| Conservative | Robert Grimston | 15,804 | 49.0 | -2.2 | |
| Liberal | Charles Byers | 10,789 | 33.5 | +0.2 | |
| Labour | R. St John Reade | 5,641 | 17.5 | +2.0 | |
| Majority | 5,015 | 15.5 | -2.4 | ||
| Turnout | 32,234 | 80.1 | -5.3 | ||
| Conservative hold | Swing | -1.2 | |||
General Election 1939–40
Another General Election was required to take place before the end of 1940. The political parties had been making preparations for an election to take place and by the Autumn of 1939, the following candidates had been selected;
- Conservative: Robert Grimston
- Liberal: Harcourt Johnstone[32]
- Labour: George Ward[33]
Elections in the 1940s edit
| Party | Candidate | Votes | % | ±% | |
|---|---|---|---|---|---|
| Conservative | Robert Grimston | 14,328 | 39.0 | -10.0 | |
| Labour | George Ward | 13,397 | 36.5 | +19.0 | |
| Liberal | Walter Geoffrey Milne | 9,004 | 24.5 | -9.0 | |
| Majority | 931 | 2.5 | -13.0 | ||
| Turnout | 36,729 | 75.5 | -4.6 | ||
| Conservative hold | Swing | -14.5 | |||
Elections in the 1950s edit
| Party | Candidate | Votes | % | ±% | |
|---|---|---|---|---|---|
| Conservative | Robert Grimston | 17,445 | 39.5 | +0.5 | |
| Labour | Reginald James Travess | 15,766 | 35.6 | -0.9 | |
| Liberal | Harold Banning Richardson | 11,031 | 24.9 | +0.4 | |
| Majority | 1,679 | 3.9 | +1.4 | ||
| Turnout | 44,242 | 86.3 | +10.8 | ||
| Conservative hold | Swing | ||||
| Party | Candidate | Votes | % | ±% | |
|---|---|---|---|---|---|
| Conservative | Robert Grimston | 19,654 | 43.7 | +4.2 | |
| Labour | Reginald James Travess | 17,623 | 39.2 | +3.6 | |
| Liberal | Harold Banning Richardson | 7,666 | 17.1 | -7.8 | |
| Majority | 2,031 | 4.5 | +0.6 | ||
| Turnout | 44,943 | 86.2 | -0.1 | ||
| Conservative hold | Swing | ||||
| Party | Candidate | Votes | % | ±% | |
|---|---|---|---|---|---|
| Conservative | Robert Grimston | 19,684 | 45.6 | +1.9 | |
| Labour | Reginald James Travess | 16,295 | 37.8 | -1.4 | |
| Liberal | Peter Leslie Martin Hurd | 7,165 | 16.6 | -0.5 | |
| Majority | 3,389 | 7.8 | +3.3 | ||
| Turnout | 43,144 | 82.4 | -3.8 | ||
| Conservative hold | Swing | ||||
| Party | Candidate | Votes | % | ±% | |
|---|---|---|---|---|---|
| Conservative | Robert Grimston | 20,396 | 45.6 | 0.0 | |
| Labour | Jasper Ridley | 14,570 | 32.5 | -5.3 | |
| Liberal | Basil Wigoder | 9,816 | 21.9 | +5.3 | |
| Majority | 5,826 | 13.1 | +5.3 | ||
| Turnout | 44,782 | 84.1 | +1.7 | ||
| Conservative hold | Swing | ||||
Elections in the 1960s edit
| Party | Candidate | Votes | % | ±% | |
|---|---|---|---|---|---|
| Conservative | Dennis Walters | 19,950 | 43.1 | -2.5 | |
| Labour | Philip William Hopkins | 15,049 | 32.6 | +0.1 | |
| Liberal | Basil Wigoder | 11,232 | 24.3 | +2.4 | |
| Majority | 4,901 | 10.5 | -2.6 | ||
| Turnout | 46,231 | 82.8 | -1.3 | ||
| Conservative hold | Swing | ||||
| Party | Candidate | Votes | % | ±% | |
|---|---|---|---|---|---|
| Conservative | Dennis Walters | 20,989 | 43.6 | +0.5 | |
| Labour | Philip William Hopkins | 18,192 | 37.8 | +5.2 | |
| Liberal | Iain Meiklejohn Fowler | 8,962 | 18.6 | -5.7 | |
| Majority | 2,797 | 5.8 | -4.7 | ||
| Turnout | 48,143 | 82.5 | -0.3 | ||
| Conservative hold | Swing | ||||
Elections in the 1970s edit
| Party | Candidate | Votes | % | ±% | |
|---|---|---|---|---|---|
| Conservative | Dennis Walters | 26,524 | 50.3 | +6.7 | |
| Labour | John McLaren | 17,413 | 33.0 | -4.8 | |
| Liberal | Robert George Otter | 8,781 | 16.7 | -1.9 | |
| Majority | 9,111 | 17.3 | +11.5 | ||
| Turnout | 52,718 | 77.0 | -5.5 | ||
| Conservative hold | Swing | ||||
| Party | Candidate | Votes | % | ±% | |
|---|---|---|---|---|---|
| Conservative | Dennis Walters | 26,197 | 43.0 | -7.3 | |
| Liberal | A. W. Glyn Court | 17,778 | 29.2 | +12.5 | |
| Labour | Anthony J. Smith | 16,453 | 27.0 | -6.0 | |
| Wessex Regionalist | Viscount Weymouth | 521 | 0.8 | New | |
| Majority | 8,419 | 13.8 | -3.5 | ||
| Turnout | 60,949 | 83.5 | +6.5 | ||
| Conservative hold | Swing | ||||
| Party | Candidate | Votes | % | ±% | |
|---|---|---|---|---|---|
| Conservative | Dennis Walters | 24,172 | 41.7 | -1.3 | |
| Liberal | A. W. Glyn Court | 18,129 | 31.3 | +2.1 | |
| Labour | Anthony J. Smith | 15,613 | 27.0 | 0.0 | |
| Majority | 6,043 | 10.4 | -3.4 | ||
| Turnout | 57,914 | 78.7 | -4.7 | ||
| Conservative hold | Swing | ||||
| Party | Candidate | Votes | % | ±% | |
|---|---|---|---|---|---|
| Conservative | Dennis Walters | 29,929 | 47.2 | +5.5 | |
| Liberal | P. Jackson | 15,950 | 25.1 | -6.2 | |
| Labour | P. R. Atkins | 12,532 | 19.8 | -7.2 | |
| Independent | S. Alexander | 2,547 | 4.0 | New | |
| Wessex Regionalist | Tom Thatcher | 1,905 | 3.0 | New | |
| Ecology | Sally Rodwell | 554 | 0.9 | New | |
| Majority | 13,979 | 22.1 | +11.7 | ||
| Turnout | 63,417 | 79.7 | +1.0 | ||
| Conservative hold | Swing | ||||
Elections in the 1980s edit
| Party | Candidate | Votes | % | ±% | |
|---|---|---|---|---|---|
| Conservative | Dennis Walters | 31,133 | 51.4 | ||
| Liberal | David J. Hughes | 22,627 | 37.4 | ||
| Labour | Haydn W. Thomas | 6,058 | 10.0 | ||
| Ecology | Paul W. Ekins | 609 | 1.0 | ||
| Wessex Regionalist | John C. Banks | 131 | 0.2 | ||
| Majority | 8,506 | 14.0 | |||
| Turnout | 60,558 | 75.5 | |||
| Conservative hold | Swing | ||||
| Party | Candidate | Votes | % | ±% | |
|---|---|---|---|---|---|
| Conservative | Dennis Walters | 34,256 | 51.6 | +0.2 | |
| Liberal | David J. Hughes | 24,159 | 36.4 | -1.0 | |
| Labour | Haydn W. Thomas | 7,982 | 12.0 | +2.0 | |
| Majority | 10,097 | 15.2 | +1.2 | ||
| Turnout | 66,397 | 78.2 | +2.73 | ||
| Registered electors | 84,860 | ||||
| Conservative hold | Swing | +0.1 | |||
Elections in the 1990s edit
| Party | Candidate | Votes | % | ±% | |
|---|---|---|---|---|---|
| Conservative | David Faber | 36,568 | 50.4 | -1.2 | |
| Liberal Democrats | Vivienne A. Rayner | 23,950 | 33.0 | -3.4 | |
| Labour | William Stallard | 9,642 | 13.3 | +1.3 | |
| Liberal | Paul I. Macdonald | 1,440 | 2.0 | New | |
| Green | Patrick R. French | 880 | 1.2 | New | |
| Majority | 12,618 | 17.4 | +2.2 | ||
| Turnout | 72,488 | 82.8 | +4.6 | ||
| Registered electors | 87,356 | ||||
| Conservative hold | Swing | +1.1 | |||
| Party | Candidate | Votes | % | ±% | |
|---|---|---|---|---|---|
| Conservative | David Faber | 23,037 | 40.6 | -9.8 | |
| Liberal Democrats | John Miller | 16,969 | 29.9 | -3.1 | |
| Labour | Kevin Small | 11,969 | 21.1 | +7.8 | |
| Liberal | George Hawkins | 1,956 | 3.4 | +1.4 | |
| Referendum | Nick Hawkings-Byass | 1,909 | 3.4 | New | |
| UKIP | R. Westbury | 771 | 1.4 | New | |
| Natural Law | Colin Haysom | 140 | 0.2 | New | |
| Majority | 6,068 | 10.7 | -6.7 | ||
| Turnout | 56,751 | 76.2 | -6.6 | ||
| Registered electors | 74,457 | ||||
| Conservative hold | Swing | 3.4 | |||
Elections in the 2000s edit
| Party | Candidate | Votes | % | ±% | |
|---|---|---|---|---|---|
| Conservative | Andrew Murrison | 21,299 | 42.1 | +1.5 | |
| Liberal Democrats | David Vigar | 16,005 | 31.6 | +1.7 | |
| Labour | Sarah Cardy | 10,847 | 21.4 | +0.3 | |
| UKIP | Charles Booth-James | 1,261 | 2.5 | +1.1 | |
| Green | Bob Gledhill | 1,216 | 2.4 | New | |
| Majority | 5,294 | 10.5 | -0.2 | ||
| Turnout | 50,628 | 66.6 | -9.6 | ||
| Registered electors | 76,056 | ||||
| Conservative hold | Swing | +0.1 | |||
| Party | Candidate | Votes | % | ±% | |
|---|---|---|---|---|---|
| Conservative | Andrew Murrison | 24,749 | 44.5 | +2.4 | |
| Liberal Democrats | Duncan Hames | 19,400 | 34.9 | +3.3 | |
| Labour | Paul Gibby | 9,640 | 17.3 | -4.1 | |
| UKIP | Lincoln Williams | 1,815 | 3.3 | +0.8 | |
| Majority | 5,346 | 9.6 | -0.9 | ||
| Turnout | 55,604 | 67.0 | +0.4 | ||
| Registered electors | 82,380 | ||||
| Conservative hold | Swing | +0.4 | |||
Notes and references edit
Craig, F. W. S. (1983). British parliamentary election results 1918-1949 (3 ed.). Chichester: Parliamentary Research Services. ISBN 0-900178-06-X.
- ^ a b c d e f g h i "History of Parliament". History of Parliament Trust. Retrieved 27 October 2011.
- ^ a b c d e f g h i j "History of Parliament". History of Parliament Trust. Retrieved 27 October 2011.
- ^ Wilfrid Prest, ‘Ley, James, first earl of Marlborough (1550–1629)’, Oxford Dictionary of National Biography, Oxford University Press, Sept 2004|| online edn, Jan 2008 [1], accessed 22 Jan 2009.
- ^ a b c Leigh Rayment's Historical List of MPs – Constituencies beginning with "W" (part 2)
- ^ Expelled from the House of Commons for corrupt misuse of Parliamentary Privilege
- ^ a b In December 1702,William Trenchard and Thomas Phipps were returned. A petition was lodged, and the result was overturned on 1 December 1702 in favour of Robert Bertie and Henry Bertie
- ^ a b At the general election in January 1715, Willoughby Bertie and Francis Annesley were returned. A petition was lodged, and the result was overturned on 1 June 1715 in favour of the runners-up Lord Carbery and Charles Allanson
- ^ a b At the 1722 general election, James Bertie was also elected for Middlesex, which he chose to represent, and never sat for Westbury. A by-election for his seat was held in March 1723
- ^ a b At the 1747 general election, John Bance and Paul Methuen were returned. A petition was lodged, and the result was overturned on 16 March 1748 in favour of the runners-up Chauncy Townsend and Paul Methuen
- ^ The by-election in 1753 was caused by the death of Matthew Michell
- ^ The by-election in 1770 was caused by the appointment of William Blackstone as a judge of the King's Bench
- ^ later Regius Professor of Civil Law at Oxford
- ^ Created a baronet, December 1782
- ^ Ellis was also elected for Seaford, which he chose to represent, and never sat for Westbury
- ^ a b c d e f g h i j k l m n o p q r s t u v w x y z Stooks Smith, Henry (1845). The Parliaments of England, from 1st George I., to the Present Time. Vol II: Oxfordshire to Wales Inclusive. London: Simpkin, Marshall, & Co. pp. 121–123. Retrieved 22 December 2018 – via Google Books.
- ^ Churton, Edward (1838). The Assembled Commons or Parliamentary Biographer: 1838. p. 38. Retrieved 22 December 2018 – via Google Books.
- ^ "John Ivatt Briscoe". Legacies of British Slave-ownership. University College London. Retrieved 18 August 2018.
- ^ "Pamphlet: A Letter on the Nature and Effects of the Tread-Wheel". British Library. Retrieved 18 August 2018.
- ^ A Member of the Middle Temple (1838). The Assembled Commons or Parliamentary Biographer: With An Abstract of the Law of Election, and the Usages of Parliament. London: Scott, Webster, and Geary. pp. 38, 70 – via Google Books.
- ^ "The General Election". Morning Post. 24 July 1847. p. 3. Retrieved 6 May 2018 – via British Newspaper Archive.
- ^ Rosser, Alexander S. (2009). "Businessmen in the House of Commons: A Comparative Study of the 1852–1857 and the 1895–1900 Parliaments". KU Scholar Works. University of Kansas. p. 65. Retrieved 22 July 2018.
- ^ Roberts, F. David (2002). The Social Conscience of the Early Victorians. Stanford: Stanford University Press. p. 123. ISBN 9780804780933. Retrieved 22 July 2018 – via Google Books.
- ^ The election of 1868 was held void on petition, and a by-election held
- ^ Created a baronet, 1952
- ^ a b c Farrell, Stephen. "Westbury". The History of Parliament. Retrieved 30 April 2020.
- ^ a b c d e f g h i j k l m Craig, F. W. S., ed. (1977). British Parliamentary Election Results 1832-1885 (e-book) (1st ed.). London: Macmillan Press. p. 326. ISBN 978-1-349-02349-3.
- ^ "Local Intelligence". Salisbury and Winchester Journal. 31 July 1847. p. 3. Retrieved 22 December 2018 – via British Newspaper Archive.
- ^ "Election Petitions". Bolton Evening News. 6 February 1869. p. 4. Retrieved 22 March 2018 – via British Newspaper Archive.
- ^ a b c d e f g h i j Craig, F. W. S., ed. (1974). British Parliamentary Election Results: 1885-1918. London: Macmillan Press. p. 417. ISBN 9781349022984.
- ^ "West Wilts Parliamentary Election". Warminster and Westbury Journal and Wilts County Advertiser. 2 July 1886. p. 4. Retrieved 14 December 2017 – via British Newspaper Archive.
- ^ British parliamentary election results 1918-1949, Craig, F. W. S. (1974)
- ^ The Liberal Magazine, 1939
- ^ Report of the Annual Conference of the Labour Party, 1939
- ^ a b c d e f g h F W S Craig, British Parliamentary Election Results 1950-1973; Political Reference Publications, Glasgow 1973
- ^ a b c The Times, House of Commons
- ^ "Election Data 1983". Electoral Calculus. Archived from the original on 15 October 2011. Retrieved 18 October 2015.
- ^ "UK General Election results June 1987". Richard Kimber's Political Science Resources. Retrieved 1 February 2011.
- ^ "UK General Election results April 1992". Richard Kimber's Political Science Resources. Retrieved 6 December 2010.
- ^ "Westbury: General Election result, May 1997". Richard Kimber's Political Science Resources. Retrieved 1 February 2011.
- ^ "Westbury: General Election result, May 1997". Richard Kimber's Political Science Resources. Retrieved 1 February 2011.
- ^ "UK General Election results May 2005". Richard Kimber's Political Science Resources. Retrieved 1 February 2011.
Sources edit
- Guardian Unlimited (2004). Ask Aristotle - Westbury. Retrieved 16 November 2004.
- D Brunton & D H Pennington, Members of the Long Parliament (London: George Allen & Unwin, 1954)
- "Cobbett's Parliamentary history of England, from the Norman Conquest in 1066 to the year 1803" (London: Thomas Hansard, 1808) [2]