
KNOWPIA
WELCOME TO KNOWPIA

Wirral Metropolitan Borough Council elections 
Summary
Wirral Metropolitan Borough Council elections are held every four years from 2023 onwards, having previously been held three years out of every four for a third of the council at a time. Wirral Metropolitan Borough Council, generally known as Wirral Council, is the local authority for the metropolitan borough of Wirral in Merseyside, England.[1]
Council elections edit
Since the first election in 1973, boundary changes have occurred in 1980 (where a third of the council were up for election) and in 2004 (where there was an all out election).[2][1][3]
- 1973 Wirral Metropolitan Borough Council election
- 1975 Wirral Metropolitan Borough Council election
- 1976 Wirral Metropolitan Borough Council election
- 1978 Wirral Metropolitan Borough Council election
- 1979 Wirral Metropolitan Borough Council election
- 1980 Wirral Metropolitan Borough Council election
- 1982 Wirral Metropolitan Borough Council election
- 1983 Wirral Metropolitan Borough Council election
- 1984 Wirral Metropolitan Borough Council election
- 1986 Wirral Metropolitan Borough Council election
- 1987 Wirral Metropolitan Borough Council election
- 1988 Wirral Metropolitan Borough Council election
- 1990 Wirral Metropolitan Borough Council election
- 1991 Wirral Metropolitan Borough Council election
- 1992 Wirral Metropolitan Borough Council election
- 1994 Wirral Metropolitan Borough Council election
- 1995 Wirral Metropolitan Borough Council election
- 1996 Wirral Metropolitan Borough Council election
- 1998 Wirral Metropolitan Borough Council election
- 1999 Wirral Metropolitan Borough Council election
- 2000 Wirral Metropolitan Borough Council election
- 2002 Wirral Metropolitan Borough Council election
- 2003 Wirral Metropolitan Borough Council election
- 2004 Wirral Metropolitan Borough Council election
- 2006 Wirral Metropolitan Borough Council election
- 2007 Wirral Metropolitan Borough Council election
- 2008 Wirral Metropolitan Borough Council election
- 2010 Wirral Metropolitan Borough Council election
- 2011 Wirral Metropolitan Borough Council election
- 2012 Wirral Metropolitan Borough Council election
- 2014 Wirral Metropolitan Borough Council election
- 2015 Wirral Metropolitan Borough Council election
- 2016 Wirral Metropolitan Borough Council election
- 2018 Wirral Metropolitan Borough Council election
- 2019 Wirral Metropolitan Borough Council election
- 2021 Wirral Metropolitan Borough Council election
- 2022 Wirral Metropolitan Borough Council election
- 2023 Wirral Metropolitan Borough Council election
Borough result maps edit
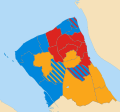
-
 1973 results map
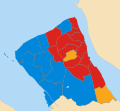
 -
 1975 results map
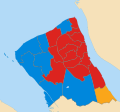
 -
1976 results map
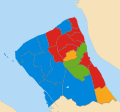
-
 1978 results map
 -
 1979 results map
 -
 1980 results map
 -
 1982 results map
 -
1983 results map
-
 1984 results map
 -
 1986 results map
 -
 1987 results map
 -
 1988 results map
 -
 1990 results map
 -
 1991 results map
 -
 1992 results map
 -
 1994 results map
 -
 1995 results map
 -
1996 results map
-
1998 results map
-
 1999 results map
 -
 2000 results map
 -
 2002 results map
 -
 2003 results map
 -
 2004 results map
 -
 2006 results map
 -
2007 results map
-
 2008 results map
 -
 2010 results map
 -
 2011 results map
 -
 2012 results map
 -
 2014 results map
 -
 2015 results map
 -
2016 results map
-
2018 results map
-
 2019 results map
 -
 2021 results map
 -
2022 results map
-
 2023 results map


Changes between election edit
1973–1979 boundaries edit
This list is incomplete; you can help by adding missing items. (June 2018) |
1979–2004 boundaries edit
This list is incomplete; you can help by adding missing items. (June 2018) |
Wallasey by-election 1997 edit
| Party | Candidate | Votes | % | ±% | |
|---|---|---|---|---|---|
| Conservative | Lesley Rennie | 1,781 | 47.3 | ||
| Labour | Elizabeth McArdle | 1,490 | 39.5 | ||
| Liberal Democrats | John Uriel | 443 | 11.8 | ||
| Green | George Bowler | 54 | 1.4 | New | |
| Majority | 291 | 7.7 | |||
| Turnout | 32.2 | ||||
| Conservative hold | Swing | ||||
Prenton by-election 2003 edit
| Party | Candidate | Votes | % | ±% | |
|---|---|---|---|---|---|
| Liberal Democrats | Francis Doyle | 1,764 | 63.3 | ||
| Conservative | Ian McKellar | 634 | 22.7 | ||
| Labour | Gerard Allen | 389 | 14.0 | ||
| Majority | 1,130 | 40.6 | |||
| Registered electors | 11,596 | ||||
| Turnout | 24.0 | ||||
| Liberal Democrats hold | Swing | ||||
2004–present boundaries edit
Moreton West and Saughall Massie by-election 2009 edit
| Party | Candidate | Votes | % | ±% | |
|---|---|---|---|---|---|
| Conservative | Steve Williams | 2,255 | 70.1 | ||
| Labour | Andrew Hollingworth | 615 | 19.1 | ||
| Liberal Democrats | Steve Pitt | 134 | 4.2 | ||
| Independent | Alec McFadden | 121 | 3.8 | New | |
| Green | Jim McGinley | 92 | 2.9 | ||
| Majority | 1,640 | 51.0 | |||
| Turnout | 28.0 | ||||
| Conservative hold | Swing | ||||
Leasowe and Moreton East by-election 2013 edit
| Party | Candidate | Votes | % | ±% | |
|---|---|---|---|---|---|
| Conservative | Ian Lewis | 1,620 | 50.5 | ||
| Labour | Pauline Daniels | 1,355 | 42.2 | ||
| UKIP | Susan Whitham | 148 | 4.6 | ||
| TUSC | Mark Halligan | 31 | 1.0 | New | |
| Liberal Democrats | Daniel Clein | 28 | 0.9 | New | |
| Green | Jim McGinley | 28 | 0.9 | ||
| Majority | 265 | 8.3 | N/A | ||
| Registered electors | 10,551 | ||||
| Turnout | 30.5 | ||||
| Conservative gain from Labour | Swing | ||||
Heswall by-election 2013 edit
| Party | Candidate | Votes | % | ±% | |
|---|---|---|---|---|---|
| Conservative | Kathryn Hodson | 1,254 | 58.8 | ||
| UKIP | David Scott | 460 | 21.6 | ||
| Labour | Mike Holliday | 289 | 13.6 | -4.2 | |
| Green | Barbara Burton | 110 | 5.2 | ||
| TUSC | Greg North | 19 | 0.9 | New | |
| Majority | 794 | 37.2 | |||
| Registered electors | 10,855 | ||||
| Turnout | 19.7 | ||||
| Conservative hold | Swing | ||||
Pensby and Thingwall by-election 2013 edit
| Party | Candidate | Votes | % | ±% | |
|---|---|---|---|---|---|
| Labour | Phillip Brightmore | 1,411 | 38.5 | ||
| Conservative | Sheila Clarke | 868 | 23.7 | ||
| Liberal Democrats | Damien Cummins | 834 | 22.7 | ||
| UKIP | Jan Davison | 426 | 11.6 | ||
| Green | Allen Burton | 74 | 2.0 | ||
| English Democrat | Neil Kenny | 53 | 1.4 | New | |
| Majority | 543 | 14.8 | |||
| Registered electors | 10,487 | ||||
| Turnout | 35.0 | ||||
| Labour gain from Conservative | Swing | ||||
Upton by-election 2013 edit
| Party | Candidate | Votes | % | ±% | |
|---|---|---|---|---|---|
| Labour | Matthew Patrick | 1,954 | 65.4 | ||
| Conservative | Geoffrey Gubb | 762 | 25.5 | ||
| Green | Jim McGinley | 143 | 4.8 | ||
| Liberal Democrats | Alan Davies | 130 | 4.3 | ||
| Majority | 1,192 | 39.9 | |||
| Registered electors | 12,154 | ||||
| Turnout | 3,031 | 24.9 | |||
| Rejected ballots | 21 | 0.7 | |||
| Labour hold | Swing | ||||
Claughton by-election 2017 edit
| Party | Candidate | Votes | % | ±% | |
|---|---|---|---|---|---|
| Labour | Gillian Wood | 1,761 | 52.4 | ||
| Liberal Democrats | David Evans | 740 | 22.0 | ||
| Conservative | Barbara Sinclair | 567 | 16.9 | ||
| Green | Liz Heydon | 136 | 4.1 | ||
| UK_Independence_Party | Beryl Jones | 130 | 3.9 | New | |
| TUSC | Leon Wheddon | 27 | 0.8 | ||
| Majority | 976 | 30.4 | |||
| Registered electors | 11,336 | ||||
| Turnout | 3,372 | 29.7 | |||
| Rejected ballots | 11 | 0.3 | |||
| Labour hold | Swing | ||||
Bromborough by-election 2018 edit
| Party | Candidate | Votes | % | ±% | |
|---|---|---|---|---|---|
| Labour Co-op | Jo Bird | 1,253 | 47.1 | ||
| Conservative | Des Drury | 749 | 28.1 | ||
| Liberal Democrats | Vicky Downie | 454 | 17.1 | ||
| Independent | Steve Niblock | 147 | 5.5 | New | |
| Green | Susan Braddock | 59 | 2.2 | ||
| Majority | 504 | 19.0 | |||
| Registered electors | 11,760 | ||||
| Turnout | 2664 | 22.7 | |||
| Rejected ballots | 2 | 0.1 | |||
| Labour hold | Swing | ||||
Upton by-election 2018 edit
| Party | Candidate | Votes | % | ±% | |
|---|---|---|---|---|---|
| Labour | Jean Robinson | 1,490 | 61.3 | ||
| Conservative | Emma Sellman | 705 | 29.0 | ||
| Green | Lily Clough | 151 | 6.2 | ||
| Liberal Democrats | Alan Davies | 83 | 3.4 | ||
| Majority | 785 | 32.3 | |||
| Registered electors | 12,040 | ||||
| Turnout | 2,434 | 20.2 | |||
| Rejected ballots | 5 | 0.2 | |||
| Labour hold | Swing | ||||
Liscard by-election 2021 edit
| Party | Candidate | Votes | % | ±% | |
|---|---|---|---|---|---|
| Labour | Daisy Kenny | 1,137 | 53.6 | ||
| Conservative | Jane Owens | 582 | 27.4 | ||
| Liberal Democrats | Sue Arrowsmith | 201 | 9.5 | ||
| Green | Edward Lamb | 109 | 5.1 | ||
| Independent | Lynda Williams | 68 | 3.2 | New | |
| For Britain | Gary Bergin | 26 | 1.2 | New | |
| Majority | 555 | 26.1 | |||
| Registered electors | 11,399 | ||||
| Turnout | 2,128 | 18.7 | |||
| Rejected ballots | 5 | 0.2 | |||
| Labour hold | Swing | ||||
Oxton by-election 2021 edit
| Party | Candidate | Votes | % | ±% | |
|---|---|---|---|---|---|
| Liberal Democrats | Orod Osanlou | 1,666 | 68.3 | ||
| Labour Co-op | Sue Mahoney[26] | 460 | 18.8 | ||
| Conservative | Philip Merry | 168 | 6.9 | ||
| Green | Mary Heydon | 147 | 6.0 | ||
| Majority | 1,206 | 49.4 | |||
| Registered electors | 10,795 | ||||
| Turnout | 22.7 | 2,447 | |||
| Rejected ballots | 6 | 0.2 | |||
| Liberal Democrats hold | Swing | ||||
Liscard by-election 2022 edit
| Party | Candidate | Votes | % | ±% | |
|---|---|---|---|---|---|
| Labour | James Laing | 1,304 | 64.8 | ||
| Conservative | Jane Owens | 370 | 18.4 | ||
| Green | Nadia Parson | 172 | 8.5 | ||
| Liberal Democrats | Sue Arrowsmith | 167 | 8.3 | ||
| Majority | 934 | 46.4 | |||
| Registered electors | 10,795 | ||||
| Turnout | 2,027 | 18.8 | |||
| Rejected ballots | 14 | 0.7 | |||
| Labour hold | Swing | ||||
Changes in affiliation edit
This list is incomplete; you can help by adding missing items. (June 2018) |
Notes edit
- ^ Later forming the Wirral Independent Network.[33]
References edit
- ^ a b "The Borough of Wirral (Electoral Changes) Order 2003", legislation.gov.uk, The National Archives, SI 2003/1980, retrieved 29 August 2022
- ^ The Borough of Wirral (Electoral Arrangements) Order 1979 SI 1979/1523
- ^ "Metropolitan Borough of Wirral Election Results 1973-2012" (PDF). The Elections Centre. Retrieved 24 November 2018.
- ^ "Kate calls Labour foul on soccer". Wirral Globe. 26 March 1997. Retrieved 27 November 2009.
- ^ "Councillor Lesley Rennie". Wirral Metropolitan Borough Council.
- ^ "Councillor Anne McArdle". Wirral Metropolitan Borough Council.
- ^ "Local Election - 05 February 2003 Prenton ward". Wirral Metropolitan Borough Council. Retrieved 26 December 2018.
- ^ "Conservatives win Moreton by-election". Wirral Globe. 27 November 2009. Retrieved 27 November 2009.
- ^ "Councillor Steve Williams". Wirral Metropolitan Borough Council.
- ^ "Election Result for Leasowe and Moreton East ward on 17 January 2013". Wirral Metropolitan Borough Council. January 2013. Retrieved 1 March 2013.
- ^ "Councillor Ian Lewis". Wirral Metropolitan Borough Council.
- ^ "Election Result for Heswall ward on 17 January 2013". Wirral Metropolitan Borough Council. January 2013. Retrieved 1 March 2013.
- ^ "Councillor Kathy Hodson". Wirral Metropolitan Borough Council.
- ^ "Election Result for Pensby and Thingwall ward on 28 February 2013". Wirral Metropolitan Borough Council. 1 March 2013. Retrieved 1 March 2013.
- ^ "Councillor Phillip Brightmore". Wirral Metropolitan Borough Council.
- ^ "Councillor Sheila Clarke MBE". Wirral Metropolitan Borough Council.
- ^ "Election Result for Upton ward on 24 October 2013". Wirral Metropolitan Borough Council.
- ^ "Councillor Matthew Patrick". Wirral Metropolitan Borough Council.
- ^ "Election results for Claughton". Wirral Metropolitan Borough Council.
- ^ "Councillor Gillian Wood". Wirral Metropolitan Borough Council.
- ^ "Election results for Bromborough Local by-election - Thursday, 23rd August 2018". Wirral Metropolitan Borough Council. Retrieved 23 August 2018.
- ^ "Councillor Jo Bird". Wirral Metropolitan Borough Council. Retrieved 20 September 2018.
- ^ "Election results for Upton Local by-election - Thursday, 22nd November 2018". Wirral Council. Retrieved 22 November 2018.
- ^ "Councillor Jean Robinson". Wirral Metropolitan Borough Council. Retrieved 3 January 2019.
- ^ "Election results for Liscard". Wirral Metropolitan Borough Council. 23 July 2021. Retrieved 23 July 2021.
- ^ Oxton Labour Party (28 October 2021). "Oxton Labour Party's post". Facebook. Retrieved 28 October 2021.
- ^ "Election results for Oxton". Wirral Metropolitan Borough Council. 25 November 2021. Retrieved 26 November 2021.
- ^ "Election results for Liscard Local by-election - Thursday, 14th July 2022". Wirral Metropolitan Borough Council. 6 May 2022. Retrieved 28 February 2023.
- ^ "Metropolitan Borough of Wirral Election Results 1973-2012" (PDF). The Elections Centre. Retrieved 28 December 2018.
- ^ a b c Harrison, Anne (4 May 1990). "Trouble ahead as voters split Wirral down middle". Liverpool Echo.
- ^ Walker, Chris (30 April 1991). "Battle Stations to woo Mersey voters". Liverpool Echo.
- ^ a b "Lib Dem councillor switches sides". Wirral Globe. Retrieved 26 December 2018.
- ^ "Local Election - 10 June 2004". Wirral Metropolitan Borough Council. 10 June 2004. Retrieved 28 December 2018.
- ^ a b "Second councillor quits". Wirral Globe. 12 February 2002. Retrieved 28 December 2018.
- ^ "No respect for mayor". Wirral Globe. 17 November 2004. Retrieved 28 December 2018.
- ^ "Why I jumped ship to join the Tories". Wirral Globe. 13 April 2005. Retrieved 28 December 2018.
- ^ "Local election - 04 May 2006". Wirral Metropolitan Borough Council. 4 May 2006. Retrieved 28 December 2018.
- ^ Copestake, Eric (19 June 2007). "Councillors also have a 'third duty'". Wirral Globe. Retrieved 28 December 2018.
- ^ Dunn, Justin (4 July 2007). "Another one bites the dust". Wirral Globe. Retrieved 28 December 2018.
- ^ Dunn, Justin; Manning, Craig (18 May 2009). "BREAKING NEWS: Labour councillor Denis Knowles quits and joins Tories at Wallasey Town Hall". Wirral Globe. Retrieved 28 December 2018.
- ^ "Wirral Lib Dem Steve Niblock defects to Labour Party". BBC News. 16 May 2011. Retrieved 28 December 2018.
- ^ Murphy, Liam (30 April 2013). "Wirral councillor Mark Johnson quits Liberal Democrat Party". Liverpool Echo. Retrieved 28 December 2018.
- ^ "Battle lines drawn for Wirral's council elections on May 5". Wirral Globe. 9 April 2016. Retrieved 31 December 2018.
- ^ "Wirral councillor quits party blaming hard left 'parasites'". Labour Uncut. 28 August 2018. Retrieved 28 December 2018.
- ^ Houghton, Tom (25 October 2018). "Senior Labour politician quits party after 40 years citing 'absolute aggression' of 'hard-left clique'". Liverpool Echo. Retrieved 28 December 2018.
- ^ Houghton, Tom (12 February 2019). "Yet ANOTHER top Labour politician quits party - blaming 'hard-left' takeover". Liverpool Echo. Retrieved 12 February 2019.
- ^ Houghton, Tom (4 March 2019). "Labour councillor suspended after 'Jew process' joke". Liverpool Echo. Retrieved 4 March 2019.
- ^ Houghton, Tom (15 March 2019). "Labour councillor who made 'Jew process' joke has suspension lifted". Liverpool Echo. Retrieved 15 March 2019.
- ^ Houghton, Tom (18 March 2019). "Labour Councillor of more than 30 years latest to quit party and slam 'hard-left' takeover". Liverpool Echo. Retrieved 18 March 2019.
- ^ Houghton, Tom (10 April 2019). "Wirral politician booted out of Labour after campaigning for rival party". Liverpool Echo. Retrieved 10 April 2019.
- ^ Thorp, Liam (17 July 2019). "Tory Councillor suspended after comparing black MP David Lammy to the Ku Klux Klan". Liverpool Echo. Retrieved 17 July 2019.
- ^ Tom, Rayner (7 February 2020). "Labour suspends two candidates in governing body election". Sky News. Retrieved 9 February 2020.
- ^ Morgan, George (18 February 2020). "Wirral councillor reinstated after second Labour suspension". Liverpool Echo. Retrieved 10 August 2022.
- ^ Morgan, George (24 August 2020). "Wirral councillor suddenly quits Greens for Independent group". Liverpool Echo. Retrieved 21 December 2020.
- ^ Morgan, George (21 July 2020). "Councillor who made racist comment about black MP could return to Tory group". Liverpool Echo. Retrieved 21 December 2020.
- ^ Lally, Kate (15 December 2020). "Wirral's Tory group leader Ian Lewis steps down from role". Wirral Globe. Retrieved 15 December 2020.
- ^ Morgan, George (19 November 2020). "Wirral Tory councillor suspended for retweet on 'Islamism'". Liverpool Echo. Retrieved 21 December 2020.
- ^ Morgan, George (9 December 2020). "Labour councillor who chaired Birkenhead meeting suspended". Wirral Globe. Retrieved 21 December 2020.
- ^ Morgan, George (11 February 2021). "Wirral councillor Tony Norbury allowed back in Labour Party". Wirral Globe. Retrieved 13 February 2021.
- ^ "Councillor Tony Cox". Wirral West and Wirral South Conservatives. Archived from the original on 27 March 2021. Retrieved 27 March 2021.
- ^ BBC News (22 November 2021). "Wirral councillor Jo Bird expelled by Labour party over banned group". BBC News. Retrieved 22 November 2021.
- ^ Morgan, George (1 April 2022). "Wirral Labour's chief whip resigns after being 'disciplined' by party". Liverpool Echo. Retrieved 2 April 2022.
- ^ Birkenhead News (22 March 2022). "Former Labour Councillor Jo Bird joins Green Party". Birkenhead News. Retrieved 22 March 2022.
- ^ Barnes, Ed (1 April 2023). "Wirral councillor claims 'dark forces' behind his deselection". Wirral Globe. Retrieved 4 April 2023.
- ^ Satoor, Paul (24 March 2023). "Notice of Election - Local Elections 2023". Wirral Metropolitan Borough Council. Archived from the original on 25 March 2023. Retrieved 25 March 2023.
- ^ Barnes, Edward (6 April 2023). "Labour councillor said she'll 'fight' for area as she takes on her own party". Wirral Globe. Retrieved 2 May 2023.
- ^ Barnes, Edward (13 April 2023). "NHS worker makes 'bullying' claim as she stands down as councillor". Wirral Globe. Retrieved 2 May 2023.
- ^ "Your Councillors". Wirral Metropolitan Borough Council. Archived from the original on 22 April 2023. Retrieved 2 May 2023.
- ^ "Your Councillors". Wirral Metropolitan Borough Council. Archived from the original on 3 May 2023. Retrieved 3 May 2023.
- By-election results
External links edit
- Wirral Metropolitan Borough Council