


Summary
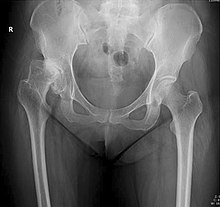
X-rays of hip dysplasia are one of the two main methods of medical imaging to diagnose hip dysplasia, the other one being medical ultrasonography.[1][2] Ultrasound imaging yields better results defining the anatomy until the cartilage is ossified. When the infant is around 3 months old a clear roentgenographic image can be achieved. Unfortunately the time the joint gives a good x-ray image is also the point at which nonsurgical treatment methods cease to give good results.
Children edit
Image quality checking edit

Reliability of measurements increases if indicators of pelvic alignment are taken into account:
- Obturator foramen diameter ratio (of Tönnis): A quotient of pelvic rotation by dividing the horizontal diameter of the obturator foramen of the right side and that of the left. In neutral rotation the ratio is 1 but is considered to be acceptable when it is between 0.56 and 1.8.[3]
- Symphysis os-ischium angle (of Tönnis): This evaluates the pelvic position in the sagittal plane. Lines are drawn from the highest point of the ischium to the most prominent point of the symphysis, joining at the inside of the pelvis. The range of normal values is from 90 to 135° and is related to the infant’s age.[3]
Measurements edit
The most useful lines and angles that can be drawn in the pediatric pelvis assessing hip dysplasia are as follows:[3]
![Normal hip.[3]](http://upload.wikimedia.org/wikipedia/commons/7/7d/X-ray_of_measurements_on_a_normal_hip.jpg)
![Hip dysplasia.[3]](http://upload.wikimedia.org/wikipedia/commons/8/84/X-ray_of_measurements_in_hip_dysplasia.jpg)
- (A) Hilgenreiner line, connects the inferior tips of the iliac bones,[4] at the triradiate cartilage. This line is used to measure the acetabular angle and as a reference for Perkin line.
- (B) Perkin line is perpendicular to Hilgenreiner line, touching the lateral margin of the acetabular roof.[5] This leads to four quadrants and a normal femoral head has to be located in the inferomedial quadrant. We can measure the lateral displacement of the femoral head with regard to the Perkin line by dividing the width of the head that crosses the Perkin line by the diameter of the head. The value for patients under 3 years must be 0 and in older children this ranges from 0 to 22%.
- (C) Shenton line is a continuous arc drawn from the inner edge of the femoral neck to the superior margin of the obturator foramen. In children over about 3 to 4 years of age, this line should be smooth and undisrupted, otherwise it may indicate a fracture or hip dysplasia.[6] However, in infants this line can be unreliable as it depends on the rotation of the hip when the image is taken.[7]
- (D) The acetabular index measures the acetabular roof slope. It is the most useful measure of acetabular dysplasia until 6 years of age. It is formed between Hilgenreiner line and the acetabular roof. In newborns, values of in males and in females are considered normal. It normally decreases with age:
![Acetabular index by age in males.[8]](http://upload.wikimedia.org/wikipedia/commons/thumb/f/f9/Acetabular_index_by_age_in_males.png/585px-Acetabular_index_by_age_in_males.png)
![Acetabular index by age in females.[8]](http://upload.wikimedia.org/wikipedia/commons/thumb/2/2d/Acetabular_index_by_age_in_females.png/488px-Acetabular_index_by_age_in_females.png)
- (E) The medial articular joint space is measured between the medial border of the femoral head or neck (when epiphysis is not ossified) and the acetabular platform. Normal values range between 5 and 12 mm. Differences greater than 1.5 mm between the two sides are considered abnormal.

- Reimer's migration index (MI), also called the femoral extrusion index,[3] is calculated if hip dysplasia is detected. It can be used to indicate hip dislocation. It is the horizontal distance (parallel to the Hilgenreiner Line) between the Perkin line and the lateral border of the ossification center of the femoral head, divided by the horizontal width of the ossification center. The migration index is normally less than 33% by most sources,[9] but 25% and 30% has also been suggested.[10]
Adults edit
Landmarks edit
In the adult hip there are important landmarks to be recognized on plain film radiographs:[3]

- The iliopectineal or iliopubic line is formed by the arcuate line of the ilium and the superior border of the superior pubic ramus up to the pubic symphysis. It conforms to the inner margin of the pelvic ring and it is part of the anterior column of the acetabulum.
- The ilioischial line of Köhler begins at the medial border of the iliac wing and extends along the medial border of the ischium to end at the ischial tuberosity. It is part of the posterior column of the acetabulum.
- The acetabular floor.
- The teardrop represents a summation of shadows. Its medial aspect corresponds to the inner cortex of the pelvis and the lateral edge with the acetabular notch and the anteroinferior portion of the quadrilateral plate. It is not present at birth but gradually develops due to pressure of the femoral head.
Measurements edit
- Fossa/ilioischial relationship: In normal conditions the floor of the acetabular fossa is lateral to the ilioischial line by 2 mm in men and 1 mm in women. When the acetabular floor overlaps or overpasses the ilioischial line, the diagnosis of coxa profunda can be made. Nevertheless, coxa profunda had been found in 76% of asymptomatic hips, mainly in women. Therefore, this as an isolate criterion is not enough to make the diagnosis of pincer-type impingement. A more severe condition is protrusio acetabuli, diagnosed when the femoral head overlaps or overpasses the ilioischial line.[3]
![Figure 5 (b). Coxa profunda.[3]](http://upload.wikimedia.org/wikipedia/commons/thumb/e/ef/X-ray_of_coxa_profunda.jpg/238px-X-ray_of_coxa_profunda.jpg)
![Figure 5 (c). Protrusio acetabuli.[3]](http://upload.wikimedia.org/wikipedia/commons/thumb/f/fa/X-ray_of_protrusio_acetabuli.jpg/217px-X-ray_of_protrusio_acetabuli.jpg)
- Joint space: In the adult hip, normal joint space ranges from 3 to 5 mm and must be uniform. Values under 2 mm are consistent with joint space narrowing.[3]
| Measurement | Image | Target | Normal value |
|---|---|---|---|
| Acetabular depth ratio | 
|
Deepness of acetabulum. | >250
|
| Center-edge angle of Wiberg |  |
The superior-lateral coverage of the femoral head. | |
| Reimer's migration index[9] | 
|
The percentage of the femoral head that lies outside of the acetabular roof. It is also called the femoral extrusion index. | <25% |
| Tönnis angle | 
|
Slope of the sourcil (the sclerotic weight-bearing portion of the acetabulum) | 0 to 10°
|
| Caput-sourcil angle[12] | 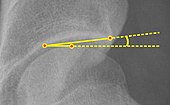
|
Superior to the Tönnis angle in cases without joint space narrowing or subluxation.[12] The medial point of the sourcil is defined as being at the same height as the most superior point of caput femoris. | −6 to 12°[12]
|
| Sharp angle | 
|
Acetabular slope | <45°
|
| Cervical diaphyseal angle | 
|
The angle formed between the femoral neck and femoral diaphysis | 120° to 140°
|
On CT, the anterior center-edge Lequesne’s angle can be measured in a false profile view of the hip or in a sagittal CT scan. In this case the tangent line touches the anterior rim of the acetabulum. Values under 20° indicate undercoverage of the femoral head.[3]
The sciatic spine and posterior wall signs are other signs associated with acetabular retroversion. The first one is considered positive when the sciatic spine is projected medial to the iliopectineal line in an AP radiography of the spine, indicating that it is not just the acetabulum but the whole hemipelvis that is twisted into retroversion. The second sign is considered positive when the posterior wall edge is medial to the center of the femoral head, indicating deficiency of the posterior wall.[3]
Although femoral version or torsion can be measured by radiographs, CT overcomes the inconsistencies demonstrated in the measurements made by biplane radiography.[3]
Crowe classification edit
In 1979 Dr. John F. Crowe et al. proposed a classification to define the degree of malformation and dislocation. Grouped from least severe Crowe I dysplasia to most severe Crowe IV.[13] This classification is very useful for studying treatment results.
Rather than using the Wiberg angle because it makes it difficult to quantify the degree of dislocation they used 3 key elements to determine the degree of subluxation: A reference line at the lower rim of the "teardrop", junction between the femoral head and neck of the respective joint and the height of the pelvis (vertical measurement). They studied anteroposterior pelvic x-rays and drew horizontal lines through the lower rim of a feature called "teardrop". The distance between this line and the middle lines of the junction between femur head and neck gave them a measure of the degree of femur head subluxation. They further established that a "normal" diameter of the femur head measures 20% of the height of the pelvis. If the middle line of the neck-head junction was more than 10% of the pelvis height above the reference line they considered the joint to be more than 50% dislocated.[13]
The following types resulted:[13]
| Class | Description | Dislocation |
| Crowe I | Femur and acetabulum show minimal abnormal development. | Less than 50% dislocation |
| Crowe II | The acetabulum shows abnormal development. | 50% to 75% dislocation |
| Crowe III | The acetabula is developed without a roof. A false acetabulum develops opposite the dislocated femur head position. The joint is fully dislocated. | 75% to 100% dislocation |
| Crowe IV | The acetabulum is insufficiently developed. Since the femur is positioned high up on the pelvis this class is also known as "high hip dislocation". | 100% dislocation |
Notes edit
References edit
- ^ "Ultrasound Detection of DDH - International Hip Dysplasia Institute". Archived from the original on 2020-12-04. Retrieved 2018-08-01.
- ^ "X-Ray Screening for Developmental Dysplasia of the Hip - International Hip Dysplasia Institute". Archived from the original on 2020-12-04. Retrieved 2018-08-01.
- ^ a b c d e f g h i j k l m n o Initially largely copied from: Ruiz Santiago, Fernando; Santiago Chinchilla, Alicia; Ansari, Afshin; Guzmán Álvarez, Luis; Castellano García, Maria del Mar; Martínez Martínez, Alberto; Tercedor Sánchez, Juan (2016). "Imaging of Hip Pain: From Radiography to Cross-Sectional Imaging Techniques". Radiology Research and Practice. 2016: 1–15. doi:10.1155/2016/6369237. ISSN 2090-1941. PMC 4738697. PMID 26885391. Attribution 4.0 International (CC BY 4.0) license
- ^ Page 298 in: Rebecca Stein-Wexler; Sandra L. Wootton-Gorges; M. B. Ozonoff (2014). Pediatric Orthopedic Imaging. Springer. ISBN 9783642453816.
- ^ Kim, Sun Mi; Sim, Eun Geol; Lim, Seong Gyu; Park, Eun Sook (2012). "Reliability of Hip Migration Index in Children with Cerebral Palsy: The Classic and Modified Methods". Annals of Rehabilitation Medicine. 36 (1): 33–38. doi:10.5535/arm.2012.36.1.33. ISSN 2234-0645. PMC 3309325. PMID 22506233.
- ^ Page 1000 in: Wood W. Lovell; Robert B. Winter; Raymond T. Morrissy; Stuart L. Weinstein (2006). Lovell and Winter's Pediatric Orthopaedics. Lippincott Williams & Wilkins. ISBN 9780781753586.
- ^ "Radiographic features: DDH". Weeless' Textbook of Orthopaedics.
- ^ a b Akel, İbrahim (2013). "Acetabular index values in healthy Turkish children between 6 months and 8 years of age: a cross-sectional radiological study". Acta Orthopaedica et Traumatologica Turcica. 47 (1): 38–42. doi:10.3944/AOTT.2013.2832. ISSN 1017-995X. PMID 23549316.
- ^ a b Pietro PERSIANI; Iakov MOLAYEM; Alessandro CALISTRI; Stefano ROSI; Marco BOVE; Ciro VILLANI (2008). "Hip subluxation and dislocation in cerebral palsy: Outcome of bone surgery in 21 hips" (PDF). Acta Orthop. Belg. Archived from the original (PDF) on 2016-12-20. Retrieved 2019-02-18.
- ^ Stott, N Susan; Piedrahita, Luis (2007). "Effects of surgical adductor releases for hip subluxation in cerebral palsy: an AACPDM evidence report*". Developmental Medicine & Child Neurology. 46 (9): 628–645. doi:10.1111/j.1469-8749.2004.tb01029.x. ISSN 0012-1622.
- ^ a b Laborie, Lene Bjerke; Engesæter, Ingvild Øvstebø; Lehmann, Trude Gundersen; Sera, Francesco; Dezateux, Carol; Engesæter, Lars Birger; Rosendahl, Karen (2013). "Radiographic measurements of hip dysplasia at skeletal maturity—new reference intervals based on 2,038 19-year-old Norwegians". Skeletal Radiology. 42 (7): 925–935. doi:10.1007/s00256-013-1574-y. ISSN 0364-2348. PMID 23354528. S2CID 8356597.
- ^ a b c Fa, Liangguo; Wang, Qing; Ma, Xiangxing (2014). "Superiority of the modified Tönnis angle over the Tönnis angle in the radiographic diagnosis of acetabular dysplasia". Experimental and Therapeutic Medicine. 8 (6): 1934–1938. doi:10.3892/etm.2014.2009. ISSN 1792-0981. PMC 4218684. PMID 25371759.
- ^ a b c Crowe JF, Mani VJ, Ranawat CS (1979). "Total hip replacement in congenital dislocation and dysplasia of the hip". J Bone Joint Surg Am. 61 (1): 15–23. doi:10.2106/00004623-197961010-00004. PMID 365863.