KNOWPIA
WELCOME TO KNOWPIA
Summary
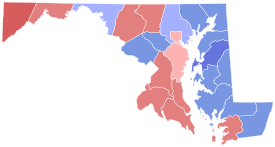
The 1920 United States Senate election in Maryland was held on November 2, 1920. Incumbent Democratic U.S. Senator John Walter Smith ran for re-election to a third term in office, but was beaten by Republican Ovington Weller.
| |||||||||||||||||||||
| |||||||||||||||||||||
 County results Weller: 40–50% 50–60% 60–70% Smith: 40–50% 50–60% 60–70% | |||||||||||||||||||||
| |||||||||||||||||||||
General election edit
Candidates edit
- William Ashbie Hawkins (Independent)
- George D. Iverson Jr., Democratic Delegate from Baltimore City (Independent)
- Frank N.H. Lang (Labor)
- John Walter Smith, incumbent Senator since 1908 (Democratic)
- William A. Toole (Socialist)
- Ovington Weller, Treasurer of the National Republican Senatorial Committee and nominee for Governor in 1915 (Republican)
Results edit
| Party | Candidate | Votes | % | |||
|---|---|---|---|---|---|---|
| Republican | Ovington Weller | 184,999 | 47.29% | |||
| Democratic | John Walter Smith (inc.) | 169,200 | 43.25% | |||
| Independent | George D. Iverson Jr. | 21,345 | 5.46% | |||
| Socialist | William A. Toole | 6,559 | 1.68% | |||
| Independent | William Ashbie Hawkins | 6,538 | 1.67% | |||
| Labor | Frank N.H. Lang | 2,569 | 0.66% | |||
| Total votes | 339,764 | 100.00% | ||||
| Republican gain from Democratic | ||||||
Results by county edit
| County | Ovington Weller
Republican |
John Walter Smith
Democratic |
William A. Toole
Socialist |
Other
Other |
Margin | Total
Votes Cast | |||||
|---|---|---|---|---|---|---|---|---|---|---|---|
| # | % | # | % | # | % | # | % | # | % | ||
| Allegany | 8550 | 52.91% | 6306 | 39.02% | 962 | 5.95% | 341 | 2.11% | 2244 | 13.89% | 16159 |
| Anne Arundel | 4666 | 47.80% | 4600 | 47.13% | 115 | 1.18% | 380 | 3.89% | 66 | 0.68% | 9761 |
| Baltimore (City) | 93646 | 47.25% | 75288 | 37.99% | 4115 | 2.08% | 25139 | 12.68% | 18358 | 9.26% | 198188 |
| Baltimore (County) | 8525 | 43.73% | 9616 | 49.33% | 195 | 1.00% | 1158 | 5.94% | -1091 | -5.60% | 19494 |
| Calvert | 1511 | 55.25% | 1046 | 38.24% | 22 | 0.80% | 156 | 5.70% | 465 | 17.00% | 2735 |
| Caroline | 2393 | 43.62% | 2941 | 53.61% | 45 | 0.82% | 107 | 1.95% | -548 | -9.99% | 5486 |
| Carroll | 4877 | 51.08% | 4461 | 46.72% | 28 | 0.29% | 182 | 1.91% | 416 | 4.36% | 9548 |
| Cecil | 2614 | 41.79% | 3434 | 54.90% | 24 | 0.38% | 183 | 2.93% | -820 | -13.11% | 6255 |
| Charles | 2400 | 56.06% | 1658 | 38.73% | 45 | 1.05% | 178 | 4.16% | 742 | 17.33% | 4281 |
| Dorchester | 3582 | 45.68% | 4089 | 52.14% | 28 | 0.36% | 143 | 1.82% | -507 | -6.47% | 7842 |
| Frederick | 8588 | 51.58% | 7695 | 46.21% | 91 | 0.55% | 277 | 1.66% | 893 | 5.36% | 16651 |
| Garrett | 2140 | 66.46% | 955 | 29.66% | 58 | 1.80% | 67 | 2.08% | 1185 | 36.80% | 3220 |
| Harford | 3085 | 40.97% | 4095 | 54.39% | 42 | 0.56% | 307 | 4.08% | -1010 | -13.41% | 7529 |
| Howard | 2230 | 46.80% | 2391 | 50.18% | 17 | 0.36% | 127 | 2.67% | -161 | -3.38% | 4765 |
| Kent | 2351 | 43.41% | 2745 | 50.68% | 40 | 0.74% | 280 | 5.17% | -394 | -7.27% | 5416 |
| Montgomery | 4993 | 42.85% | 6440 | 55.27% | 84 | 0.72% | 135 | 1.16% | -1447 | -12.42% | 11652 |
| Prince George's | 5797 | 52.79% | 4802 | 43.73% | 82 | 0.75% | 301 | 2.74% | 995 | 9.06% | 10982 |
| Queen Anne's | 1959 | 36.11% | 3317 | 61.14% | 48 | 0.88% | 101 | 1.86% | -1358 | -25.03% | 5425 |
| St. Mary's | 1802 | 50.03% | 1643 | 45.61% | 38 | 1.05% | 119 | 3.30% | 159 | 4.41% | 3602 |
| Somerset | 3103 | 50.78% | 2887 | 47.24% | 11 | 0.18% | 110 | 1.80% | 216 | 3.53% | 6111 |
| Talbot | 2898 | 46.86% | 3136 | 50.70% | 30 | 0.49% | 121 | 1.96% | -238 | -3.85% | 6185 |
| Washington | 6997 | 47.33% | 7146 | 48.34% | 354 | 2.39% | 286 | 1.93% | -149 | -1.01% | 14783 |
| Wicomico | 3590 | 41.08% | 4932 | 56.44% | 50 | 0.57% | 166 | 1.90% | -1342 | -15.36% | 8738 |
| Worcester | 2702 | 42.21% | 3577 | 55.87% | 35 | 0.55% | 88 | 1.37% | -875 | -13.67% | 6402 |
| Total | 184999 | 47.29% | 169200 | 43.25% | 6559 | 1.68% | 30452 | 7.78% | 15799 | 4.04% | 391210 |
Counties that flipped from Republican to Democrat edit
Counties that flipped from Democrat to Republican edit
See also edit
References edit
- ^ "Archives of Maryland, Volume 0125, Page 237 - Maryland Manual, 1914-15". msa.maryland.gov. Maryland State Archives. n.d. p. 237. Retrieved April 13, 2023.
- ^ "Our Campaigns - MD US Senate Race - Nov 02, 1920". www.ourcampaigns.com. Our Campaigns. n.d. Retrieved April 13, 2023.
- ^ "1920 Senatorial General Election Results - Maryland". uselectionatlas.org. Dave Leip's Atlas of U.S. Presidential Elections. March 13, 2016. Retrieved April 13, 2023.


