
KNOWPIA
WELCOME TO KNOWPIA

1940 United States presidential election in Pennsylvania 
Summary
The 1940 United States presidential election in Pennsylvania took place on November 5, 1940 as part of the 1940 United States presidential election. Voters chose 36 representatives, or electors to the Electoral College, who voted for president and vice president.
| ||||||||||||||||||||||||||
| ||||||||||||||||||||||||||
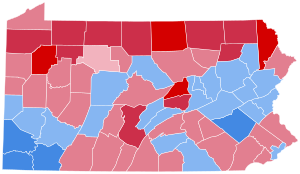 County Results
| ||||||||||||||||||||||||||
| ||||||||||||||||||||||||||


Pennsylvania voted to give Democratic nominee, President Franklin D. Roosevelt an unprecedented third term, over the Republican nominee, corporate lawyer Wendell Willkie, a dark horse candidate who had never before run for a political office. Roosevelt won Pennsylvania by a margin of 6.9%. This was the last election until 1976 that Pennsylvania voted for a different candidate than nearby Michigan.
Results edit
| 1940 United States presidential election in Pennsylvania[1] | |||||
|---|---|---|---|---|---|
| Party | Candidate | Votes | Percentage | Electoral votes | |
| Democratic | Franklin D. Roosevelt (incumbent) | 2,171,035 | 53.23% | 36 | |
| Republican | Wendell Willkie | 1,889,848 | 46.33% | 0 | |
| Socialist | Norman Thomas | 10,967 | 0.27% | 0 | |
| Communist | Earl Browder | 4,519 | 0.11% | 0 | |
| Industrial Government | John Aiken | 1,518 | 0.04% | 0 | |
| Write-ins | Write-ins | 827 | 0.02% | 0 | |
| Totals | 4,078,714 | 100.00% | 36 | ||
Results by county edit
| County | Franklin Delano Roosevelt Democratic |
Wendell Lewis Willkie Republican |
Various candidates Other parties |
Margin | Total votes cast[2] | ||||
|---|---|---|---|---|---|---|---|---|---|
| # | % | # | % | # | % | # | % | ||
| Adams | 7,354 | 46.01% | 8,609 | 53.86% | 20 | 0.13% | -1,255 | -7.85% | 15,983 |
| Allegheny | 367,926 | 58.03% | 263,285 | 41.52% | 2,849 | 0.45% | 104,641 | 16.50% | 634,060 |
| Armstrong | 12,144 | 45.44% | 14,524 | 54.34% | 60 | 0.22% | -2,380 | -8.90% | 26,728 |
| Beaver | 33,609 | 57.78% | 24,324 | 41.81% | 239 | 0.41% | 9,285 | 15.96% | 58,172 |
| Bedford | 7,388 | 45.32% | 8,864 | 54.38% | 49 | 0.30% | -1,476 | -9.05% | 16,301 |
| Berks | 53,301 | 61.31% | 32,111 | 36.94% | 1,522 | 1.75% | 21,190 | 24.37% | 86,934 |
| Blair | 21,573 | 44.65% | 26,639 | 55.13% | 106 | 0.22% | -5,066 | -10.48% | 48,318 |
| Bradford | 6,605 | 30.75% | 14,826 | 69.02% | 49 | 0.23% | -8,221 | -38.27% | 21,480 |
| Bucks | 25,169 | 54.75% | 20,586 | 44.78% | 212 | 0.46% | 4,583 | 9.97% | 45,967 |
| Butler | 13,875 | 41.52% | 19,450 | 58.20% | 96 | 0.29% | -5,575 | -16.68% | 33,421 |
| Cambria | 42,894 | 58.44% | 30,306 | 41.29% | 193 | 0.26% | 12,588 | 17.15% | 73,393 |
| Cameron | 1,450 | 44.60% | 1,793 | 55.15% | 8 | 0.25% | -343 | -10.55% | 3,251 |
| Carbon | 12,777 | 54.50% | 10,618 | 45.29% | 51 | 0.22% | 2,159 | 9.21% | 23,446 |
| Centre | 9,869 | 47.90% | 10,665 | 51.77% | 68 | 0.33% | -796 | -3.86% | 20,602 |
| Chester | 22,473 | 44.18% | 28,222 | 55.48% | 174 | 0.34% | -5,749 | -11.30% | 50,869 |
| Clarion | 6,564 | 41.99% | 9,035 | 57.79% | 34 | 0.22% | -2,471 | -15.81% | 15,633 |
| Clearfield | 17,705 | 53.23% | 15,407 | 46.32% | 148 | 0.44% | 2,298 | 6.91% | 33,260 |
| Clinton | 7,419 | 54.03% | 6,291 | 45.81% | 22 | 0.16% | 1,128 | 8.21% | 13,732 |
| Columbia | 12,523 | 56.76% | 9,518 | 43.14% | 21 | 0.10% | 3,005 | 13.62% | 22,062 |
| Crawford | 10,197 | 38.92% | 15,891 | 60.65% | 115 | 0.44% | -5,694 | -21.73% | 26,203 |
| Cumberland | 15,758 | 50.64% | 15,297 | 49.16% | 61 | 0.20% | 461 | 1.48% | 31,116 |
| Dauphin | 38,305 | 47.30% | 42,394 | 52.35% | 276 | 0.34% | -4,089 | -5.05% | 80,975 |
| Delaware | 60,225 | 42.74% | 80,158 | 56.88% | 534 | 0.38% | -19,933 | -14.15% | 140,917 |
| Elk | 6,920 | 49.78% | 6,949 | 49.99% | 31 | 0.22% | -29 | -0.21% | 13,900 |
| Erie | 31,735 | 46.19% | 36,608 | 53.29% | 355 | 0.52% | -4,873 | -7.09% | 68,698 |
| Fayette | 41,960 | 63.47% | 23,908 | 36.16% | 246 | 0.37% | 18,052 | 27.30% | 66,114 |
| Forest | 919 | 33.59% | 1,811 | 66.19% | 6 | 0.22% | -892 | -32.60% | 2,736 |
| Franklin | 12,713 | 49.21% | 13,084 | 50.64% | 39 | 0.15% | -371 | -1.44% | 25,836 |
| Fulton | 1,982 | 48.40% | 2,108 | 51.48% | 5 | 0.12% | -126 | -3.08% | 4,095 |
| Greene | 10,214 | 60.17% | 6,726 | 39.63% | 34 | 0.20% | 3,488 | 20.55% | 16,974 |
| Huntingdon | 5,631 | 37.97% | 9,141 | 61.64% | 58 | 0.39% | -3,510 | -23.67% | 14,830 |
| Indiana | 12,035 | 43.53% | 15,547 | 56.23% | 68 | 0.25% | -3,512 | -12.70% | 27,650 |
| Jefferson | 8,559 | 41.37% | 12,081 | 58.40% | 47 | 0.23% | -3,522 | -17.03% | 20,687 |
| Juniata | 3,579 | 50.46% | 3,507 | 49.44% | 7 | 0.10% | 72 | 1.02% | 7,093 |
| Lackawanna | 71,343 | 56.32% | 54,931 | 43.36% | 411 | 0.32% | 16,412 | 12.95% | 126,685 |
| Lancaster | 32,210 | 41.62% | 44,939 | 58.07% | 245 | 0.32% | -12,729 | -16.45% | 77,394 |
| Lawrence | 18,814 | 49.07% | 19,361 | 50.50% | 167 | 0.44% | -547 | -1.43% | 38,342 |
| Lebanon | 13,315 | 49.61% | 13,449 | 50.11% | 73 | 0.27% | -134 | -0.50% | 26,837 |
| Lehigh | 33,007 | 52.44% | 29,584 | 47.00% | 356 | 0.57% | 3,423 | 5.44% | 62,947 |
| Luzerne | 101,577 | 55.85% | 79,685 | 43.81% | 622 | 0.34% | 21,892 | 12.04% | 181,884 |
| Lycoming | 18,363 | 46.05% | 21,423 | 53.72% | 91 | 0.23% | -3,060 | -7.67% | 39,877 |
| McKean | 6,911 | 31.63% | 14,822 | 67.84% | 115 | 0.53% | -7,911 | -36.21% | 21,848 |
| Mercer | 16,968 | 44.42% | 21,058 | 55.12% | 175 | 0.46% | -4,090 | -10.71% | 38,201 |
| Mifflin | 6,993 | 52.31% | 6,352 | 47.51% | 24 | 0.18% | 641 | 4.79% | 13,369 |
| Monroe | 6,670 | 52.57% | 6,001 | 47.30% | 16 | 0.13% | 669 | 5.27% | 12,687 |
| Montgomery | 49,409 | 40.15% | 73,250 | 59.52% | 403 | 0.33% | -23,841 | -19.37% | 123,062 |
| Montour | 3,080 | 53.04% | 2,723 | 46.89% | 4 | 0.07% | 357 | 6.15% | 5,807 |
| Northampton | 33,304 | 56.49% | 25,385 | 43.06% | 266 | 0.45% | 7,919 | 13.43% | 58,955 |
| Northumberland | 26,315 | 53.31% | 22,914 | 46.42% | 134 | 0.27% | 3,401 | 6.89% | 49,363 |
| Perry | 4,601 | 43.87% | 5,877 | 56.03% | 11 | 0.10% | -1,276 | -12.17% | 10,489 |
| Philadelphia | 532,149 | 59.69% | 354,878 | 39.81% | 4,459 | 0.50% | 177,271 | 19.88% | 891,486 |
| Pike | 1,818 | 41.08% | 2,596 | 58.65% | 12 | 0.27% | -778 | -17.58% | 4,426 |
| Potter | 2,731 | 34.30% | 5,205 | 65.36% | 27 | 0.34% | -2,474 | -31.07% | 7,963 |
| Schuylkill | 48,739 | 52.71% | 43,505 | 47.05% | 231 | 0.25% | 5,234 | 5.66% | 92,475 |
| Snyder | 2,478 | 30.17% | 5,722 | 69.66% | 14 | 0.17% | -3,244 | -39.49% | 8,214 |
| Somerset | 14,085 | 44.71% | 17,369 | 55.13% | 52 | 0.17% | -3,284 | -10.42% | 31,506 |
| Sullivan | 1,626 | 44.04% | 2,059 | 55.77% | 7 | 0.19% | -433 | -11.73% | 3,692 |
| Susquehanna | 5,383 | 36.04% | 9,520 | 63.73% | 35 | 0.23% | -4,137 | -27.69% | 14,938 |
| Tioga | 4,434 | 27.51% | 11,645 | 72.24% | 40 | 0.25% | -7,211 | -44.74% | 16,119 |
| Union | 2,220 | 28.27% | 5,612 | 71.45% | 22 | 0.28% | -3,392 | -43.19% | 7,854 |
| Venango | 6,873 | 27.89% | 17,728 | 71.95% | 38 | 0.15% | -10,855 | -44.06% | 24,639 |
| Warren | 5,825 | 34.39% | 11,016 | 65.04% | 97 | 0.57% | -5,191 | -30.65% | 16,938 |
| Washington | 50,829 | 63.43% | 29,026 | 36.22% | 285 | 0.36% | 21,803 | 27.21% | 80,140 |
| Wayne | 3,460 | 27.26% | 9,203 | 72.50% | 30 | 0.24% | -5,743 | -45.25% | 12,693 |
| Westmoreland | 64,567 | 59.90% | 42,643 | 39.56% | 577 | 0.54% | 21,924 | 20.34% | 107,787 |
| Wyoming | 2,548 | 32.51% | 5,273 | 67.28% | 16 | 0.20% | -2,725 | -34.77% | 7,837 |
| York | 39,543 | 56.56% | 30,228 | 43.23% | 146 | 0.21% | 9,315 | 13.32% | 69,917 |
| Totals | 2,175,538 | 53.35% | 1,885,265 | 46.23% | 17,004 | 0.42% | 290,273 | 7.12% | 4,077,807 |