
KNOWPIA
WELCOME TO KNOWPIA

1967 elections in India 
Summary
The elections in India in 1967 included the 1967 Indian general election and nine state legislative assembly elections.
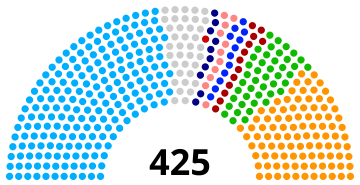
General election edit
 | |||||
|---|---|---|---|---|---|
| Party | Votes | % | Seats | +/– | |
| Indian National Congress | 59,490,701 | 40.78 | 283 | –78 | |
| Bharatiya Jana Sangh | 13,580,935 | 9.31 | 35 | +21 | |
| Swatantra Party | 12,646,847 | 8.67 | 44 | +26 | |
| Communist Party of India | 7,458,396 | 5.11 | 23 | –6 | |
| Samyukta Socialist Party | 7,171,627 | 4.92 | 23 | New | |
| Communist Party of India (Marxist) | 6,246,522 | 4.28 | 19 | New | |
| Dravida Munnetra Kazhagam | 5,529,405 | 3.79 | 25 | +18 | |
| Praja Socialist Party | 4,456,487 | 3.06 | 13 | +1 | |
| Republican Party of India | 3,607,711 | 2.47 | 1 | –2 | |
| Bangla Congress | 1,204,356 | 0.83 | 5 | New | |
| Peasants and Workers Party of India | 1,028,755 | 0.71 | 2 | +2 | |
| Akali Dal – Sant Fateh Singh | 968,712 | 0.66 | 3 | New | |
| All India Forward Bloc | 627,910 | 0.43 | 2 | 0 | |
| Indian Union Muslim League | 413,868 | 0.28 | 2 | 0 | |
| Kerala Congress | 321,219 | 0.22 | 0 | New | |
| Jammu & Kashmir National Conference | 210,020 | 0.14 | 1 | New | |
| Akali Dal – Master Tara Singh | 189,290 | 0.13 | 0 | New | |
| Jana Kranti Dal | 183,211 | 0.13 | 1 | New | |
| Jana Congress | 136,631 | 0.09 | 0 | New | |
| All Party Hill Leaders Conference | 112,492 | 0.08 | 1 | 0 | |
| United Goans – Seqveria Group | 100,137 | 0.07 | 1 | New | |
| Peoples Front | 42,725 | 0.03 | 0 | New | |
| Democratic National Conference | 30,788 | 0.02 | 0 | New | |
| United Goans – Furtadd Group | 1,714 | 0.00 | 0 | New | |
| Nagaland Nationalist Organisation | 0 | 0.00 | 1 | New | |
| Independents | 20,106,051 | 13.78 | 35 | +15 | |
| Appointed members[a] | 3 | –11 | |||
| Total | 145,866,510 | 100.00 | 523 | +15 | |
| Valid votes | 145,866,510 | 95.51 | |||
| Invalid/blank votes | 6,858,101 | 4.49 | |||
| Total votes | 152,724,611 | 100.00 | |||
| Registered voters/turnout | 250,207,401 | 61.04 | |||
| Source: ECI | |||||
- ^ Two representing Anglo-Indians and one representing the North-East Frontier Agency.
Legislative Assembly elections edit
Andhra Pradesh edit
| Party | Votes | % | Seats | |
|---|---|---|---|---|
| Bharatiya Jana Sangh | 291,783 | 2.11 | 3 | |
| Communist Party of India | 1,077,499 | 7.78 | 11 | |
| Communist Party of India (Marxist) | 1,053,855 | 7.61 | 9 | |
| Indian National Congress | 6,292,649 | 45.42 | 165 | |
| Praja Socialist Party | 28,564 | 0.21 | 0 | |
| Republican Party of India | 36,757 | 0.27 | 1 | |
| Samyukta Socialist Party | 49,669 | 0.36 | 1 | |
| Swatantra Party | 1,363,382 | 9.84 | 29 | |
| Independents | 3,658,928 | 26.41 | 68 | |
| Total | 13,853,086 | 100.00 | 287 | |
| Valid votes | 13,853,086 | 85.59 | ||
| Invalid/blank votes | 2,333,093 | 14.41 | ||
| Total votes | 16,186,179 | 100.00 | ||
| Registered voters/turnout | 20,934,068 | 77.32 | ||
| Source: ECI[1] | ||||
Assam edit

| |||||||||
|---|---|---|---|---|---|---|---|---|---|
| Political Party | Flag | Seats Contested |
Won | % of Seats |
Votes | Vote % | |||
| Indian National Congress | 120 | 73 | 44.66% | 1354748 | 43.60% | ||||
| All Party Hill Leaders Conference | 12 | 9 | 57.86% | 108447 | 3.49% | ||||
| Communist Party of India | 22 | 7 | 30.19% | 108447 | 5.15% | ||||
| Praja Socialist Party | 35 | 5 | 23.20% | 213094 | 6.86% | ||||
| Samyukta Socialist Party | 17 | 4 | 26.37% | 101802 | 3.28% | ||||
| Swatantra Party | 13 | 2 | 14.07% | 46187 | 1.49% | ||||
| Independent | 124 | 26 | 36.12% | 1004695 | 32.33% | ||||
| Total Seats | 105 | Voters | 5449305 | Turnout | 3369230 (61.83%) | ||||
Bihar edit
| Party | Votes | % | Seats | +/– | |
|---|---|---|---|---|---|
| Indian National Congress | 4,479,460 | 33.09 | 128 | –57 | |
| Samyukta Socialist Party | 2,385,961 | 17.62 | 68 | New | |
| Bharatiya Jana Sangh | 1,410,722 | 10.42 | 26 | +23 | |
| Praja Socialist Party | 942,889 | 6.96 | 18 | –11 | |
| Communist Party of India | 935,977 | 6.91 | 24 | +12 | |
| Jan Kranti Dal | 451,412 | 3.33 | 13 | New | |
| Swatantra Party | 315,184 | 2.33 | 3 | –47 | |
| Communist Party of India (Marxist) | 173,656 | 1.28 | 4 | New | |
| Republican Party of India | 23,893 | 0.18 | 1 | New | |
| Independents | 2,419,469 | 17.87 | 33 | –21 | |
| Total | 13,538,623 | 100.00 | 318 | 0 | |
| Valid votes | 13,538,623 | 73.37 | |||
| Invalid/blank votes | 4,914,436 | 26.63 | |||
| Total votes | 18,453,059 | 100.00 | |||
| Registered voters/turnout | 27,743,190 | 66.51 | |||
| Source: ECI[3] | |||||
Delhi edit
 | ||||||
|---|---|---|---|---|---|---|
| Party | Seats | |||||
| Elected | Nominated | Total | ||||
| Bharatiya Jana Sangh | 33 | 2 | 35 | |||
| Indian National Congress | 19 | 2 | 21 | |||
| Republican Party of India | 2 | 0 | 2 | |||
| Independents | 2 | 1 | 3 | |||
| Total | 56 | 5 | 61 | |||
| Source: Parveen,[4] Delhi Gazetteer[5] | ||||||
Goa, Daman and Diu edit
| Political Party |
Seats contested |
Seats won |
Number of Votes |
% of Votes | |
|---|---|---|---|---|---|
| Maharashtrawadi Gomantak Party | 26 | 16 | 111,110 | 40.42% | |
| United Goans Party (Sequeira Group) | 30 | 12 | 104,426 | 37.98% | |
| Independents | 156 | 2 | 48,471 | 17.63% | |
| Total[7] | 226 | 30 | 264.007 | 100% | |
Gujarat edit
Haryana edit
 | ||||
|---|---|---|---|---|
| Party | Votes | % | Seats | |
| Indian National Congress | 1,252,290 | 41.33 | 48 | |
| Bharatiya Jana Sangh | 436,145 | 14.39 | 12 | |
| Samyukta Socialist Party | 108,172 | 3.57 | 0 | |
| Swatantra Party | 96,410 | 3.18 | 3 | |
| Republican Party of India | 87,861 | 2.90 | 2 | |
| Communist Party of India | 27,238 | 0.90 | 0 | |
| Communist Party of India (Marxist) | 16,379 | 0.54 | 0 | |
| Praja Socialist Party | 6,477 | 0.21 | 0 | |
| Independents | 998,969 | 32.97 | 16 | |
| Total | 3,029,941 | 100.00 | 81 | |
| Valid votes | 3,029,941 | 76.48 | ||
| Invalid/blank votes | 931,825 | 23.52 | ||
| Total votes | 3,187,946 | – | ||
| Registered voters/turnout | 4,387,980 | 72.65 | ||
| Source: ECI[8] | ||||
Himachal Pradesh edit
 | ||||
|---|---|---|---|---|
| Party | Votes | % | Seats | |
| Indian National Congress | 323,247 | 42.19 | 34 | |
| Bharatiya Jana Sangh | 106,261 | 13.87 | 7 | |
| Communist Party of India | 22,173 | 2.89 | 2 | |
| Swatantra Party | 14,767 | 1.93 | 1 | |
| Others | 7,787 | 1.02 | 0 | |
| Independents | 291,884 | 38.10 | 16 | |
| Total | 766,119 | 100.00 | 60 | |
| Valid votes | 766,119 | 94.54 | ||
| Invalid/blank votes | 44,234 | 5.46 | ||
| Total votes | 810,353 | 100.00 | ||
| Registered voters/turnout | 1,582,103 | 51.22 | ||
| Source: ECI[9] | ||||
Jammu and Kashmir edit
Kerala edit
| Political Party | Flag | Seats Contested |
Won | Net Change in seats |
% of Seats |
Votes | Vote % | Change in vote % | |
|---|---|---|---|---|---|---|---|---|---|
| Bharatiya Jana Sangh | 22 | 0 | NA | 0 | 55,584 | 0.88 | NA | ||
| Communist Party of India | 22 | 19 | 14.29 | 538,004 | 8.57 | ||||
| Communist Party of India (Marxist) | 59 | 52 | 39.10 | 1,476,456 | 23.51 | ||||
| Indian National Congress | 133 | 9 | 6.77 | 2,789,556 | 35.43 | ||||
| Praja Socialist Party | 7 | 0 | NA | 0 | 13,991 | 0.22 | NA | ||
| Samyukta Socialist Party | 21 | 19 | 6 | 14.29 | 527,662 | 8.4 | |||
| Swatantra Party | 6 | 0 | NA | 14.29 | 13,105 | 0.21 | NA | ||
| Kerala Congress | 61 | 5 | 3.76 | 475,172 | 7.57 | ||||
| IUML | 15 | 14 | 10.53 | 424,159 | 6.75 | ||||
| Independent | 75 | 15 | 11.28 | 531,783 | 8.47 | ||||
| Total Seats | 133 ( |
Voters | 8,613,658 | Turnout | 6,518,272 (75.67%) | ||||
Madras edit

| |||||||
|---|---|---|---|---|---|---|---|
| Alliances | Party | Popular Vote | Vote % | Seats contested | Seats won | Change | |
| United Front[14]
|
Dravida Munnetra Kazhagam | 6,230,552 | 40.69% | 174 | 137 | ||
| Swatantra Party | 811,232 | 5.30% | 27 | 20 | |||
| CPI(M) | 623,114 | 4.07% | 22 | 11 | |||
| Praja Socialist Party | 136,188 | 0.89% | 4 | 4 | |||
| Indian Union Muslim League | 95,494 | 0.62% | 3 | 3 | |||
| Samyukta Socialist Party | 84,188 | 0.55% | 3 | 2 | |||
| DMK Backed Independents | 70,665 | 0.46% | 2 | 2 | |||
| Indian National Congress Seats: 51 Seat Change: Popular Vote: 6,293,378 Popular Vote %: 41.10% |
Indian National Congress | 6,293,378 | 41.10% | 232 | 51 | ||
| Others Seats: 4 Seat Change: |
Independent | 591,214 | 3.86% | 246 | 1 | ||
| Communist Party of India | 275,932 | 1.80% | 32 | 2 | |||
| Forward Bloc | 44,714 | 0.29% | 1 | 1 | |||
| Republican Party of India | 31,286 | 0.20% | 13 | 0 | |||
| Bharatiya Jana Sangh | 22,745 | 0.15% | 24 | 0 | |||
| Total | 11 Political Parties | 15,310,702 | 100% | — | 234 | ||
Maharashtra edit
| Political Party |
No. of candidates |
No. of elected |
Number of Votes |
% of Votes |
Seat change | |
|---|---|---|---|---|---|---|
| Indian National Congress | 270 | 203 | 6,288,564 | 47.03% | ||
| Peasants and Workers Party of India | 58 | 19 | 1,043,239 | 7.80% | ||
| Communist Party of India | 41 | 10 | 651,077 | 4.87% | ||
| Praja Socialist Party | 66 | 8 | 545,935 | 4.08% | ||
| Republican Party of India | 79 | 5 | 890,377 | 6.66% | ||
| Bharatiya Jana Sangh | 166 | 4 | 1,092,670 | 8.17% | ||
| Samyukta Socialist Party | 48 | 4 | 616,466 | 4.61% | ||
| Communist Party of India (Marxist) | 11 | 1 | 145,083 | 1.08% | ||
| Independents | 463 | 16 | 1,948,223 | 14.57% | ||
| Total | 1242 | 270 | 13,371,735 |
Manipur edit
 | |||||
|---|---|---|---|---|---|
| Party | Votes | % | Seats | +/– | |
| Indian National Congress | 101,504 | 32.53 | 16 | New | |
| Sanghata Socialist Party | 36,520 | 11.70 | 4 | New | |
| Communist Party of India | 17,062 | 5.47 | 1 | New | |
| Praja Socialist Party | 2,417 | 0.77 | 0 | New | |
| Communist Party of India (Marxist) | 2,093 | 0.67 | 0 | New | |
| Independents | 152,419 | 48.85 | 9 | New | |
| Total | 312,015 | 100.00 | 30 | 0 | |
| Valid votes | 312,015 | 82.00 | |||
| Invalid/blank votes | 68,505 | 18.00 | |||
| Total votes | 380,520 | 100.00 | |||
| Registered voters/turnout | 468,707 | 81.19 | |||
| Source: ECI[15] | |||||
Mysore edit
| Political Party |
Contestants |
Seats won |
Seat change |
Number of votes |
Vote share |
Net change | |
|---|---|---|---|---|---|---|---|
| Indian National Congress | 216 | 126 | 3,636,374 | 48.43% | |||
| Praja Socialist Party | 52 | 20 | 666,662 | 8.88% | |||
| Swatantra Party | 45 | 16 | 497,055 | 6.62% | |||
| Samyukta Socialist Party | 17 | 6 | 185,222 | 2.47% | |||
| Bharatiya Jana Sangh | 37 | 4 | 211,966 | 2.82% | |||
| Independents | 41 | 2,129,786 | 28.36% | N/A | |||
| Total | 216 |
Odisha edit
| Political Party | Flag | Seats Contested |
Won | Net Change in seats |
% of Seats |
Votes | Vote % | Change in vote % | |
|---|---|---|---|---|---|---|---|---|---|
| Indian National Congress | 140 | 31 | 22.14 | 12,35,149 | 30.66 | ||||
| Bharatiya Jana Sangh | 19 | 0 | "New" | 0 | 21,788 | 4.07 | "New" | ||
| Praja Socialist Party | 33 | 21 | 7.85 | 4,93,750 | 41.16 | ||||
| Communist Party of India | 31 | 7 | 5 | 2,11,999 | 20.71 | ||||
| Communist Party of India (Marxist) | 10 | 1 | "New" | 0.71 | 46,597 | 18.16 | "New" | ||
| Swatantra Party | 101 | 49 | "New" | 35 | 9,09,421 | 34.78 | "New" | ||
| JAC | 47 | 26 | "New" | 18.57 | 5,42,734 | 37.17 | "New" | ||
| Independent | 21 | 2 | N/A | 1.42 | 5,05,394 | 17.72 | N/A | ||
| Total Seats | 140 ( |
Voters | 98,73,057 | Turnout | 43,48,838 (44.05%) | ||||
Punjab edit
| Result of Punjab Legislative Assembly election 1967[16] | ||||||
|---|---|---|---|---|---|---|
| Part | contested | Seats won | change in seats | popular vote | % | |
| Akali Dal - Sant Fateh Singh | 59 | 24 | 8,71,742 | 20.48 | ||
| Bharatiya Jana Sangh | 49 | 9 | 4,18,921 | 9.84% | ||
| Communist Party of India | 19 | 5 | 2,21,494 | 5.20% | ||
| Communist Party of India (Marxist) | 13 | 3 | 1,38,857 | 3.26% | ||
| Republican Party of India | 17 | 3 | 76,089 | 1.79% | ||
| Akali Dal Master Tara Singh Group | 61 | 2 | 1,78,746 | 4.20% | ||
| Socialist Party | 8 | 1 | 30,591 | 0.72% | ||
| Independents | 235 | 9 | 6,83,369 | 16.05% | ||
| Indian National Congress | 102 | 48 | 15,94,160 | 37.45% | ||
| Others | 19 | 0 | 43,144 | 1.02% | ||
| Total[17] | 602 | 104 | 42,57,113 | |||
Parties in green box formed coalition government
Rajasthan edit
 | |||||
|---|---|---|---|---|---|
| Party | Votes | % | Seats | +/– | |
| Indian National Congress | 2,798,411 | 41.42 | 89 | +1 | |
| Swatantra Party | 1,493,018 | 22.10 | 48 | +12 | |
| Bharatiya Jana Sangh | 789,609 | 11.69 | 22 | +7 | |
| Sanghata Socialist Party | 321,574 | 4.76 | 8 | New | |
| Communist Party of India | 79,826 | 1.18 | 0 | 0 | |
| Communist Party of India | 65,531 | 0.97 | 1 | –4 | |
| Praja Socialist Party | 54,618 | 0.81 | 0 | –2 | |
| Jai Telangana Party | 45,576 | 0.67 | 0 | New | |
| Republican Party of India | 8,932 | 0.13 | 0 | New | |
| Independents | 1,099,169 | 16.27 | 16 | –6 | |
| Total | 6,756,264 | 100.00 | 184 | +8 | |
| Valid votes | 6,756,264 | 79.34 | |||
| Invalid/blank votes | 1,759,342 | 20.66 | |||
| Total votes | 8,515,606 | 100.00 | |||
| Registered voters/turnout | 10,002,447 | 85.14 | |||
| Source: ECI[18] | |||||
Tripura edit
| Party | Seats Contested | Seats Won | No. of Votes | % of Votes | 1963 Seats |
|---|---|---|---|---|---|
| Bharatiya Jana Sangh | 5 | 0 | 1,506 | 0.35% | No data available |
| Communist Party of India | 7 | 1 | 34,562 | 7.97% | No data available |
| Communist Party of India (Marxist) | 16 | 2 | 93,739 | 21.61% | No data available |
| Indian National Congress | 30 | 27 | 251,345 | 57.95% | No data available |
| Sanghata Socialist Party | 1 | 0 | 83 | 0.02% | No data available |
| Independents | 28 | 0 | 52,457 | 12.10% | No data available |
| Total | 87 | 30 | 433,692 |
Uttar Pradesh edit
 | ||||||
|---|---|---|---|---|---|---|
| Party | Votes | % | +/– | Seats | +/– | |
| Indian National Congress | 6,912,104 | 32.20 | 199 | |||
| Bharatiya Jana Sangh | 4,651,738 | 21.67 | 98 | |||
| Samyukta Socialist Party | 2,140,924 | 9.97 | 44 | |||
| Communist Party of India | 692,942 | 3.23 | 13 | |||
| Swatantra Party | 1,016,284 | 4.73 | 12 | |||
| Praja Socialist Party | 878,738 | 4.09 | 11 | |||
| Republican Party of India | 889,010 | 4.14 | 10 | |||
| Communist Party of India (Marxist) | 272,565 | 1.27 | new party | 1 | new party | |
| Independents | 4,013,661 | 18.70 | 37 | |||
| Total | 21,467,966 | 100.00 | – | 425 | ||
| Valid votes | 21,467,966 | 93.38 | ||||
| Invalid/blank votes | 1,521,785 | 6.62 | ||||
| Total votes | 22,989,751 | 100.00 | ||||
| Registered voters/turnout | 42,148,100 | 54.55 | ||||
West Bengal edit
| Political Party |
No. of candidates |
No. of elected |
Number of Votes |
% of Votes |
Seat change | |
|---|---|---|---|---|---|---|
| Indian National Congress | 280 | 127 | 5,207,930 | 41.13% | ||
| Communist Party of India (Marxist) | 135 | 43 | 2,293,026 | 18.11% | ||
| Bangla Congress | 80 | 34 | 1,286,028 | 10.16% | ||
| Communist Party of India | 62 | 16 | 827,196 | 6.53% | ||
| All India Forward Bloc | 42 | 13 | 561,148 | 4.43% | ||
| Samyukta Socialist Party | 26 | 7 | 269,234 | 2.13% | ||
| Praja Socialist Party | 26 | 7 | 238,694 | 1.88% | ||
| Revolutionary Socialist Party | 16 | 6 | 238,694 | 2.14% | ||
| Socialist Unity Centre of India | 8 | 4 | 238,694 | 0.72% | ||
| Marxist Forward Bloc | 58 | 1 | 167,934 | 1.33% | ||
| Revolutionary Communist Party of India | 58 | 1 | 167,934 | 1.33% | ||
| Bharatiya Jana Sangh | 58 | 1 | 167,934 | 1.33% | ||
| Swatantra Party | 21 | 1 | 102,576 | 0.81% | ||
| Independents | 327 | 31 | 1,708,011 | 13.49% | ||
| Total | 1058 | 280 | 12,663,030 |
References edit
- ^ "Statistical Report on General Election, 1967 to the Legislative Assembly of Andhra Pradesh". Election Commission of India. Retrieved 22 December 2021.
- ^ "Statistical Report on General Election, 1967 : To the Legislative Assembly of Assam". Election Commission of India. Retrieved 28 March 2020.
- ^ "Statistical Report on General Election, 1967 to the Legislative Assembly of Bihar". Election Commission of India. Retrieved 29 November 2021.
- ^ Nazima Parveen (2021). Contested Homelands: Politics of Space and Identity. Bloomsbury Publishing. ISBN 9789389000917.
BJS won thirty-three of fifty-six seats of the Delhi Metropolitan Council election in 1967..
- ^ Radha Raman, ed. (1 April 1976). Delhi Gazetteer - 1976. Delhi. p. 974.
{{cite book}}: CS1 maint: location missing publisher (link) - ^ "STATISTICAL REPORT ON GENERAL ELECTION, 1967 TO THE LEGISLATIVE ASSEMBLY OF GOA DAMAN & DIU" (PDF). Election Commission of India. Archived from the original (PDF) on 27 January 2013.
- ^ The total includes votes and contestants of all parties, even those who failed to win one seat
- ^ "Haryana 1967". Election Commission of India. Retrieved 13 February 2022.
- ^ "Himachal Pradesh General Legislative Election 1967". Election Commission of India. Retrieved 8 July 2021.
- ^ "STATISTICAL REPORT ON GENERAL ELECTION, 1967 TO THE LEGISLATIVE ASSEMBLY OF KERALA" (PDF). www.ceo.kerala.gov.in. ELECTION COMMISSION OF INDIA NEW DELHI.
- ^ Thomas Johnson Nossiter (1 January 1982). Communism in Kerala: A Study in Political Adaptation. University of California Press. p. 128. ISBN 978-0-520-04667-2.
- ^ "The Madras Legislative Assembly, 1962-67, A Review" (PDF). assembly.tn.gov.in. 24 August 1976. Archived from the original (PDF) on 3 February 2022.
- ^ "Tamil Nadu 1967".
- ^ Siddhartan, N. S. (17 June 1967). "Voting Pattern in the Fourth General Election. I: D M K Success in Madras". Economic and Political Weekly. 2 (24): 1083–88. JSTOR 4358065.
- ^ "Statistical Report on General Election, 1967 to the Legislative Assembly of Manipur". Election Commission of India. Retrieved 20 October 2021.
- ^ "List of Polling Booth For Punjab Lok Sabha Elections 1967". www.elections.in.
- ^ "Statistical Report on General Election Punjab 1967". Election Commission of India.
- ^ "Statistical Report on General Election, 1967 to the Legislative Assembly of Rajasthan". Election Commission of India. Retrieved 22 December 2021.
- ^ "1967 Tripura Election result".
- ^ "Statistical Report on General Election, 1967 to the Legislative Assembly of West Bengal" (PDF). Archived from the original (PDF) on 27 January 2013.
External links edit
Wikimedia Commons has media related to 1967 elections in India.
- Election Commission of India