


Summary
The 2020 United States House of Representatives elections in Arizona were held on November 3, 2020, to elect the nine U.S. representatives from the state of Arizona, one from each of the state's nine congressional districts. The elections coincided with the 2020 U.S. presidential election, as well as other elections to the House of Representatives, elections to the United States Senate and various state and local elections. This election was the first time since 1990 in which no third-party candidates appeared on the ballot in the House of Representatives elections.[1]
| |||||||||||||||||||||||||
All 9 Arizona seats to the United States House of Representatives | |||||||||||||||||||||||||
|---|---|---|---|---|---|---|---|---|---|---|---|---|---|---|---|---|---|---|---|---|---|---|---|---|---|
| |||||||||||||||||||||||||

| |||||||||||||||||||||||||
Arizona was notable in 2020 for being one of two states, the other being North Carolina, in which the party receiving the majority of votes held a minority of congressional seats.
Overview edit
Statewide edit
| Party | Candidates | Votes | Seats | ||||
|---|---|---|---|---|---|---|---|
| No. | % | No. | +/– | % | |||
| Republican | 9 | 1,638,516 | 50.13 | 4 | 44.44 | ||
| Democratic | 9 | 1,629,318 | 49.85 | 5 | 55.56 | ||
| Write-in | 5 | 415 | 0.01 | 0 | 0.0 | ||
| Total | 23 | 3,268,249 | 100.0 | 9 | 100.0 | ||
By district edit
Results of the 2020 United States House of Representatives elections in Arizona by district:[2]
| District | Democratic | Republican | Others | Total | Result | ||||
|---|---|---|---|---|---|---|---|---|---|
| Votes | % | Votes | % | Votes | % | Votes | % | ||
| District 1 | 188,469 | 51.61% | 176,709 | 48.39% | 0 | 0.00% | 365,178 | 100.0% | Democratic hold |
| District 2 | 209,945 | 55.10% | 170,975 | 44.87% | 134 | 0.04% | 381,054 | 100.0% | Democratic hold |
| District 3 | 174,243 | 64.57% | 95,594 | 35.43% | 0 | 0.00% | 269,837 | 100.0% | Democratic hold |
| District 4 | 120,484 | 30.23% | 278,002 | 69.74% | 137 | 0.04% | 398,623 | 100.0% | Republican hold |
| District 5 | 183,171 | 41.10% | 262,414 | 58.88% | 72 | 0.02% | 445,657 | 100.0% | Republican hold |
| District 6 | 199,644 | 47.83% | 217,783 | 52.17% | 0 | 0.00% | 417,427 | 100.0% | Republican hold |
| District 7 | 165,452 | 76.69% | 50,226 | 23.28% | 54 | 0.03% | 215,732 | 100.0% | Democratic hold |
| District 8 | 170,816 | 40.43% | 251,633 | 59.56% | 18 | 0.00% | 422,467 | 100.0% | Republican hold |
| District 9 | 217,094 | 61.63% | 135,180 | 38.37% | 0 | 0.00% | 352,274 | 100.0% | Democratic hold |
| Total | 1,629,318 | 49.85% | 1,638,516 | 50.13% | 415 | 0.01% | 3,268,249 | 100.0% | |
District 1 edit
| |||||||||||||||||
 Shedd: 50-60% 60–70% O'Halleran: 50–60% 60-70% 80-90%  Shedd: 50–60% 60–70% 70–80% 80–90% >90% O'Halleran: 50–60% 60–70% 70–80% 80–90% >90% Tie: 50% No votes | |||||||||||||||||
| |||||||||||||||||


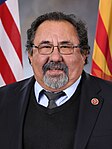
The 1st district is based in the northeastern part of the state, encompassing the Phoenix and Tucson metropolitan areas, taking in Casa Grande, Maricopa, Oro Valley, and Marana. The district also includes the Navajo Nation, Hopi Reservation, and Gila River Indian Community. Incumbent Democrat Tom O'Halleran, who had represented the district since 2017, ran for re-election. He was re-elected with 53.8% of the vote in 2018.[3] The district had a PVI of R+2.
Democratic primary edit
Candidates edit
Nominee edit
- Tom O'Halleran, incumbent U.S. representative[4]
Eliminated in primary edit
Withdrawn edit
- Barbara McGuire, former state senator[6][7]
- Larry Williams, retail worker[8][9]
Endorsements edit
- Organizations
- Brand New Congress[17]
- Climate Strike – Arizona[18]
- Friends of the Earth Action[19]
- National Women's Political Caucus (NWPC)[20]
- Our Revolution[18]
- Our Revolution Flagstaff Chapter[18]
- Peace Action[21]
- Progressive Democrats of America[22]
- Sunrise Movement – Flagstaff chapter[18]
- Individuals
- Marianne Williamson, author and 2020 Democratic presidential candidate[23]
Primary results edit
| Party | Candidate | Votes | % | |
|---|---|---|---|---|
| Democratic | Tom O'Halleran (incumbent) | 47,083 | 58.6 | |
| Democratic | Eva Putzova | 33,248 | 41.4 | |
| Total votes | 80,331 | 100.0 | ||
Republican primary edit
Candidates edit
Nominee edit
- Tiffany Shedd, attorney, small business owner, firearms instructor and candidate for this seat in 2018[25]
Eliminated in primary edit
- Nolan Reidhead, attorney[26]
Withdrawn edit
- John Moore, Mayor of Williams[27][28]
- Doyel Shamley, former Apache County supervisor[29]
- Chris Taylor, Safford city councilman[30][31] (endorsed Reidhead)[32]
Declined edit
- Curt Schilling, former Major League Baseball pitcher for Arizona Diamondbacks and Boston Red Sox[33]
Endorsements edit
- Federal officials
- Jon Kyl, former U.S. Senator from Arizona (1995–2013, 2018)[34]
- Kevin McCarthy, Minority Leader of the United States House of Representatives[35]
- Organizations
Primary results edit
| Party | Candidate | Votes | % | |
|---|---|---|---|---|
| Republican | Tiffany Shedd | 40,310 | 54.7 | |
| Republican | Nolan Reidhead | 33,418 | 45.3 | |
| Total votes | 73,728 | 100.0 | ||
General election edit
Debate edit
| No. | Date | Host | Moderator | Link | Democratic | Republican |
|---|---|---|---|---|---|---|
| Key: P Participant A Absent N Not invited I Invited W Withdrawn |
||||||
| Tom O'Halleran | Tiffany Shedd | |||||
| 1 | Oct. 8, 2020 | KAET KJZZ (FM) The Arizona Republic |
Steve Goldstein Yvonne Wingett Sanchez Ted Simons |
YouTube | P | P |
Predictions edit
| Source | Ranking | As of |
|---|---|---|
| The Cook Political Report[37] | Lean D | November 2, 2020 |
| Inside Elections[38] | Likely D | October 28, 2020 |
| Sabato's Crystal Ball[39] | Likely D | November 2, 2020 |
| Daily Kos[40] | Lean D | November 2, 2020 |
| RCP[41] | Lean D | November 2, 2020 |
| Decision Desk HQ[42] | Likely D | November 3, 2020 |
| 538[43] | Likely D | November 3, 2020 |
| Elections Daily[44] | Likely D | November 1, 2020 |
| CNN[45] | Likely D | November 1, 2020 |
| Politico[46] | Lean D | November 2, 2020 |
| Niskanen[47] | Safe D | June 7, 2020 |
Results edit
| Party | Candidate | Votes | % | |
|---|---|---|---|---|
| Democratic | Tom O'Halleran (incumbent) | 188,469 | 51.6 | |
| Republican | Tiffany Shedd | 176,709 | 48.4 | |
| Total votes | 365,178 | 100.0 | ||
| Democratic hold | ||||
District 2 edit
| |||||||||||||||||
 Kirkpatrick: 50-60% Martin: 50–60%  Kirkpatrick: 50–60% 60–70% 70–80% 80–90% Martin: 50–60% 60–70% 70–80% Tie: 50% No votes | |||||||||||||||||
| |||||||||||||||||


The 2nd district is located in southeastern Arizona, encompassing the eastern Tucson area. Incumbent Democrat Ann Kirkpatrick, who had represented the district since , ran for re-election. He was re-elected with 54.7% of the vote in 2018.[3] The district had a PVI of R+1.
Democratic primary edit
Candidates edit
Nominee edit
- Ann Kirkpatrick, incumbent U.S. representative[49]
Eliminated in primary edit
- Peter Quilter, national security professional[50]
Endorsements edit
- Labor unions
- AFL–CIO[51]
- American Federation of State, County and Municipal Employees[51]
- American Physical Therapy Association[51]
- American Society of Anesthesiologists[51]
- International Brotherhood of Electrical Workers[51]
- International Brotherhood of Teamsters – Joint Council 25[51]
- UNITE HERE[51]
- United Food and Commercial Workers[51]
- Organizations
- American Association for Justice[51]
- American Crystal Sugar Company[51]
- EMILY's List[51]
- End Citizens United[51]
- Giffords Law Center to Prevent Gun Violence[51]
- Human Rights Campaign[51]
- NARAL Pro-Choice America[51]
- National Committee to Preserve Social Security and Medicare[51]
- Planned Parenthood[51]
- Newspapers
Primary results edit
| Party | Candidate | Votes | % | |
|---|---|---|---|---|
| Democratic | Ann Kirkpatrick (incumbent) | 77,517 | 76.3 | |
| Democratic | Peter Quilter | 24,035 | 23.7 | |
| Total votes | 101,552 | 100.0 | ||
Republican primary edit
Candidates edit
Nominee edit
Eliminated in primary edit
Withdrawn edit
- Mike Ligon, author[54]
- Shay Stautz, former lobbyist for University of Arizona[55][56]
- Justine Wadsack, realtor and small business owner[57][58] (running for State Senate)
Primary results edit
| Party | Candidate | Votes | % | |
|---|---|---|---|---|
| Republican | Brandon Martin | 31,730 | 42.5 | |
| Republican | Noran Ruden | 25,049 | 33.6 | |
| Republican | Joseph Morgan | 17,802 | 23.8 | |
| Republican | Jordan Flayer (write-in) | 52 | 0.1 | |
| Total votes | 74,633 | 100.0 | ||
General election edit
Predictions edit
| Source | Ranking | As of |
|---|---|---|
| The Cook Political Report[37] | Safe D | November 2, 2020 |
| Inside Elections[38] | Safe D | October 28, 2020 |
| Sabato's Crystal Ball[39] | Safe D | November 2, 2020 |
| Daily Kos[40] | Safe D | November 2, 2020 |
| RCP[41] | Likely D | November 2, 2020 |
| Decision Desk HQ[42] | Safe D | November 3, 2020 |
| 538[43] | Safe D | November 3, 2020 |
| Elections Daily[44] | Safe D | November 1, 2020 |
| CNN[45] | Safe D | November 1, 2020 |
| Politico[46] | Likely D | November 2, 2020 |
| Niskanen[47] | Safe D | June 7, 2020 |
Results edit
| Party | Candidate | Votes | % | |
|---|---|---|---|---|
| Democratic | Ann Kirkpatrick (incumbent) | 209,945 | 55.1 | |
| Republican | Brandon Martin | 170,975 | 44.9 | |
| Write-in | 134 | 0.0 | ||
| Total votes | 381,054 | 100.0 | ||
| Democratic hold | ||||
District 3 edit
| |||||||||||||||||
 Grijalva: 50–60% 60-70% 70-80% >90%  Grijalva: 50–60% 60–70% 70–80% 80–90% >90% Wood: 50–60% 60–70% 70–80% 80–90% No votes | |||||||||||||||||
| |||||||||||||||||
The 3rd district encompasses southwestern Arizona, taking in Yuma, western Tucson, as well as stretching into the western suburbs of Phoenix, including Goodyear, Avondale, southern Buckeye, and a small portion of West Phoenix. Incumbent Democrat Raúl Grijalva, who had represented the district since , ran for re-election. He was re-elected with 63.9% of the vote in 2018.[3] The district had a PVI of D+13.
Democratic primary edit
Candidates edit
Nominee edit
- Raúl Grijalva, incumbent U.S. representative[59]
Primary results edit
| Party | Candidate | Votes | % | |
|---|---|---|---|---|
| Democratic | Raúl Grijalva (incumbent) | 63,282 | 100.0 | |
| Total votes | 63,282 | 100.0 | ||
Republican primary edit
Candidates edit
Nominee edit
- Daniel Wood, U.S. Marine Corps veteran[60]
Withdrawn edit
Primary results edit
| Party | Candidate | Votes | % | |
|---|---|---|---|---|
| Republican | Daniel Wood | 29,260 | 99.8 | |
| Republican | Richard Jolley (write-in) | 44 | 0.2 | |
| Total votes | 29,304 | 100.0 | ||
General election edit
Predictions edit
| Source | Ranking | As of |
|---|---|---|
| The Cook Political Report[37] | Safe D | November 2, 2020 |
| Inside Elections[38] | Safe D | October 28, 2020 |
| Sabato's Crystal Ball[39] | Safe D | November 2, 2020 |
| Daily Kos[40] | Safe D | November 2, 2020 |
| RCP[41] | Safe D | November 2, 2020 |
| Decision Desk HQ[42] | Safe D | November 3, 2020 |
| 538[43] | Safe D | November 3, 2020 |
| Elections Daily[44] | Safe D | November 1, 2020 |
| CNN[45] | Safe D | November 1, 2020 |
| Politico[46] | Safe D | November 2, 2020 |
| Niskanen[47] | Safe D | June 7, 2020 |
Results edit
| Party | Candidate | Votes | % | |
|---|---|---|---|---|
| Democratic | Raúl Grijalva (incumbent) | 174,243 | 64.6 | |
| Republican | Daniel Wood | 95,594 | 35.4 | |
| Total votes | 269,837 | 100.0 | ||
| Democratic hold | ||||
District 4 edit
| |||||||||||||||||
 Gosar: 60-70% 70-80%  Gosar: 50–60% 60–70% 70–80% 80–90% >90% DiSanto: 50–60% 60–70% No votes | |||||||||||||||||
| |||||||||||||||||

The 4th district is located in north-central Arizona, taking in Lake Havasu City, Prescott, and the Phoenix exurbs, including San Tan Valley, Apache Junction, and northern Buckeye. The incumbent was Republican Paul Gosar, who was re-elected with 68.2% of the vote in 2018.[3]
Republican primary edit
Candidates edit
Nominee edit
- Paul Gosar, incumbent U.S. representative[63]
Eliminated in primary edit
- Anne Marie Ward, former business consultant and former staffer to U.S. Senator Martha McSally[64]
Primary results edit
| Party | Candidate | Votes | % | |
|---|---|---|---|---|
| Republican | Paul Gosar (incumbent) | 82,370 | 63.1 | |
| Republican | Anne Marie Ward | 48,116 | 36.9 | |
| Total votes | 130,486 | 100.0 | ||
Democratic primary edit
Candidates edit
Nominee edit
Eliminated in primary edit
- Stuart "Stu" Starky, nominee for U.S. Senate in 2004 and former school principal[66]
Primary results edit
| Party | Candidate | Votes | % | |
|---|---|---|---|---|
| Democratic | Delina DiSanto | 34,345 | 74.3 | |
| Democratic | Stu Starky | 11,852 | 25.7 | |
| Total votes | 46,197 | 100.0 | ||
General election edit
Predictions edit
| Source | Ranking | As of |
|---|---|---|
| The Cook Political Report[37] | Safe R | November 2, 2020 |
| Inside Elections[38] | Safe R | October 28, 2020 |
| Sabato's Crystal Ball[39] | Safe R | November 2, 2020 |
| Daily Kos[40] | Safe R | November 2, 2020 |
| RCP[41] | Safe R | November 2, 2020 |
| Decision Desk HQ[42] | Safe R | November 3, 2020 |
| 538[43] | Safe R | November 3, 2020 |
| Elections Daily[44] | Safe R | November 1, 2020 |
| CNN[45] | Safe R | November 1, 2020 |
| Politico[46] | Safe R | November 2, 2020 |
| Niskanen[47] | Safe R | June 7, 2020 |
Results edit
| Party | Candidate | Votes | % | |
|---|---|---|---|---|
| Republican | Paul Gosar (incumbent) | 278,002 | 69.7 | |
| Democratic | Delina DiSanto | 120,484 | 30.2 | |
| Write-in | 137 | 0.0 | ||
| Total votes | 398,623 | 100.0 | ||
| Republican hold | ||||
District 5 edit
| |||||||||||||||||
 Precinct results Biggs: 50–60% 60–70% 70–80% Greene: 50–60% 60–70% | |||||||||||||||||
| |||||||||||||||||

The 5th district is centered around the eastern suburbs of Phoenix, including Gilbert, Queen Creek, southern and eastern Chandler, and eastern Mesa. The incumbent was Republican Andy Biggs, who was re-elected with 59.4% of the vote in 2018.[3]
Republican primary edit
Candidates edit
Declared edit
- Andy Biggs, incumbent U.S. representative[67]
Primary results edit
| Party | Candidate | Votes | % | |
|---|---|---|---|---|
| Republican | Andy Biggs (incumbent) | 104,888 | 99.6 | |
| Republican | Joe Vess (write-in) | 465 | 0.4 | |
| Total votes | 105,353 | 100.0 | ||
Democratic primary edit
Candidates edit
Declared edit
- Joan Greene, businesswoman and nominee for Arizona's 5th congressional district in 2018[49]
- Jonathan Ireland, educator and musician[68]
- Javier Ramos, attorney[69]
Primary results edit
| Party | Candidate | Votes | % | |
|---|---|---|---|---|
| Democratic | Joan Greene | 34,070 | 50.0 | |
| Democratic | Javier Ramos | 26,818 | 39.4 | |
| Democratic | Jonathan Ireland | 7,209 | 10.6 | |
| Total votes | 68,097 | 100.0 | ||
General election edit
Predictions edit
| Source | Ranking | As of |
|---|---|---|
| The Cook Political Report[37] | Safe R | November 2, 2020 |
| Inside Elections[38] | Safe R | October 28, 2020 |
| Sabato's Crystal Ball[39] | Safe R | November 2, 2020 |
| Daily Kos[40] | Safe R | November 2, 2020 |
| RCP[41] | Safe R | November 2, 2020 |
| Decision Desk HQ[42] | Safe R | November 3, 2020 |
| 538[43] | Safe R | November 3, 2020 |
| Elections Daily[44] | Safe R | November 1, 2020 |
| CNN[45] | Safe R | November 1, 2020 |
| Politico[46] | Safe R | November 2, 2020 |
| Niskanen[47] | Safe R | June 7, 2020 |
Results edit
| Party | Candidate | Votes | % | |
|---|---|---|---|---|
| Republican | Andy Biggs (incumbent) | 262,414 | 58.9 | |
| Democratic | Joan Greene | 183,171 | 41.1 | |
| Write-in | 72 | 0.0 | ||
| Total votes | 445,657 | 100.0 | ||
| Republican hold | ||||
District 6 edit
| |||||||||||||||||
 Precinct results Schweikert: 50–60% 60–70% 70–80% Tipirneni: 50–60% 60–70% 70–80% No votes | |||||||||||||||||
| |||||||||||||||||


The 6th district covers parts of the northeastern suburbs of Phoenix, containing Scottsdale, Paradise Valley, Cave Creek, Fountain Hills, as well as a portion of North Phoenix, including Deer Valley and Desert View. The incumbent was Republican David Schweikert, who was re-elected with 55.2% of the vote in 2018.[3]
Republican primary edit
Candidates edit
Declared edit
- David Schweikert, incumbent U.S. representative[70]
Endorsements edit
- Organizations
Primary results edit
| Party | Candidate | Votes | % | |
|---|---|---|---|---|
| Republican | David Schweikert (incumbent) | 94,434 | 100.0 | |
| Total votes | 94,434 | 100.0 | ||
Democratic primary edit
Candidates edit
Declared edit
- Karl Gentles, businessman[72]
- Anita Malik, businesswoman, entrepreneur, and nominee for Arizona's 6th congressional district in 2018[73]
- Stephanie Rimmer, businesswoman[74]
- Hiral Tipirneni, emergency room physician and nominee for Arizona's 8th congressional district in the 2018 special and general elections[75]
Endorsements edit
- Organizations
- Federal officials
- Ann Kirkpatrick, U.S. representative (AZ-02)[76]
- Barack Obama, 44th president Of The United States[77]
- Tom O'Halleran, U.S. representative (AZ-01)[76]
- State officials
- Lela Alston, state senator and former state representative (2011–2019)[78]
- Rich Andrade, state representative[78]
- Charlene Fernandez, state representative and state House minority leader[78]
- Randy Friese, state representative[78]
- Robert Meza, state representative and former state senator state senator (2011–2019) and state representative (2003–2011)[78]
- Jamescita Peshlakai, state senator and former state representative (2013–2015)[78]
- Martín Quezada, state senator and former state representative (2013–2015)[78]
- Rebecca Rios, state senator and former state House minority leader (2017–2019), state representative (2015–2019), and state senator (2005–2011)[78]
- Victoria Steele, state senator and former state representative (2013–2016)[78]
- Labor unions
- AFT Arizona[79]
- Amalgamated Transit Union Local 1433[79]
- Communication Workers of America Arizona State Council[79]
- International Association of Sheet Metal, Air, Rail and Transportation Workers (SMART) Local 359[79]
- International Brotherhood of Electrical Workers Local 640[79]
- International Brotherhood of Teamsters Local 104[79]
- International Union of Painters and Allied Trades[79]
- United Food and Commercial Workers Local 99[79]
- Organizations
- 314 Action Fund[80]
- AAPI Victory Fund[79]
- Arizona Stonewall Democrats[81]
- ASPIRE PAC[82]
- Brady Campaign[83]
- Congressional Hispanic Caucus (CHC) Bold PAC[79]
- Elect AAPI[79]
- EMILY's List[84]
- End Citizens United[85]
- Equality PAC[79]
- Everytown for Gun Safety Action Fund[86]
- High School Democrats of America[11]
- Human Rights Campaign[87]
- League of Conservation Voters Action Fund[88]
- NARAL Pro-Choice America[89]
- NewDem Action Fund[90]
- Off the Sidelines PAC[79]
- Planned Parenthood Action Fund[16]
- Sierra Club[91]
Polling edit
| Poll source | Date(s) administered |
Sample size[a] |
Margin of error |
Karl Gentles |
Anita Malik |
Stephanie Rimmer |
Hiral Tipirneni |
Undecided |
|---|---|---|---|---|---|---|---|---|
| OH Predictive Insights Archived August 6, 2020, at the Wayback Machine | August 3, 2020 | 400 (LV) | ± 4.9% | 3% | 30% | 2% | 53% | 12% |
| Zogby Strategies (D)[A] | August 28–30, 2019 | 400 (LV) | – | – | 20% | 12% | 13% | 55% |
Primary results edit
| Party | Candidate | Votes | % | |
|---|---|---|---|---|
| Democratic | Hiral Tipirneni | 42,538 | 53.2 | |
| Democratic | Anita Malik | 29,218 | 36.5 | |
| Democratic | Stephanie Rimmer | 4,592 | 5.7 | |
| Democratic | Karl Gentles | 3,651 | 4.6 | |
| Total votes | 79,999 | 100.0 | ||
General election edit
Predictions edit
| Source | Ranking | As of |
|---|---|---|
| The Cook Political Report[37] | Tossup | November 2, 2020 |
| Inside Elections[38] | Tossup | October 28, 2020 |
| Sabato's Crystal Ball[39] | Lean D (flip) | November 2, 2020 |
| Daily Kos[40] | Tossup | November 2, 2020 |
| RCP[41] | Lean R | November 2, 2020 |
| Decision Desk HQ[42] | Tossup | November 3, 2020 |
| 538[43] | Tossup | November 3, 2020 |
| Elections Daily[44] | Lean R | November 1, 2020 |
| CNN[45] | Tossup | November 1, 2020 |
| Politico[46] | Tossup | November 2, 2020 |
| Niskanen[47] | Lean R | June 7, 2020 |
Polling edit
- Graphical summary
| Poll source | Date(s) administered |
Sample size[a] |
Margin of error |
David Schweikert (R) |
Hiral Tipirneni (D) |
Undecided |
|---|---|---|---|---|---|---|
| Public Policy Polling (D)[B] | October 26–27, 2020 | 582 (LV) | – | 41% | 45% | – |
| OH Predictive Insights Archived October 14, 2020, at the Wayback Machine | September 23–27, 2020 | 531 (LV) | ± 4.3% | 49% | 46% | 5% |
| GQR Research (D)[C] | September 23–26, 2020 | 500 (LV) | ± 4.4% | 45% | 49% | 6% |
| Public Policy Polling (D) Archived March 7, 2021, at the Wayback Machine[D] | September 22–23, 2020 | 527 (V) | – | 45% | 43% | 12% |
| GQR Research (D)[C] | August 6–12, 2020 | 548 (LV) | ± 4.2% | 45% | 48% | – |
| DCCC Targeting & Analytics Department (D)[E] | July 29 – August 1, 2020 | 586 (LV) | ± 4.0% | 46% | 43% | – |
- with Generic Republican and Generic Democrat
| Poll source | Date(s) administered |
Sample size[a] |
Margin of error |
Generic Republican |
Generic Democrat |
Undecided |
|---|---|---|---|---|---|---|
| PPP Archived March 7, 2021, at the Wayback Machine | September 22–23, 2020 | 527 (V) | – | 48% | 47% | 5% |
Results edit
| Party | Candidate | Votes | % | |
|---|---|---|---|---|
| Republican | David Schweikert (incumbent) | 217,783 | 52.2 | |
| Democratic | Hiral Tipirneni | 199,644 | 47.8 | |
| Total votes | 417,427 | 100.0 | ||
| Republican hold | ||||
District 7 edit
| |||||||||||||||||
 Precinct results Gallego: 50–60% 60–70% 70–80% 80–90% >90% Barnett: 50–60% Tie: 50% No votes | |||||||||||||||||
| |||||||||||||||||

The 7th district encompasses Downtown Phoenix and western Phoenix, including the urban villages of Maryvale, Estrella, Laveen, South Mountain, Central City, Encanto, and Alhambra, as well as Tolleson and southern Glendale. The incumbent was Democrat Ruben Gallego, who was re-elected with 85.6% of the vote in 2018 without major-party opposition.[3]
Democratic primary edit
Candidates edit
Declared edit
- Ruben Gallego, incumbent U.S. representative[92]
Primary results edit
| Party | Candidate | Votes | % | |
|---|---|---|---|---|
| Democratic | Ruben Gallego (incumbent) | 56,037 | 100.0 | |
| Total votes | 56,037 | 100.0 | ||
Republican primary edit
Candidates edit
Declared edit
- Josh Barnett, entrepreneur[69]
Primary results edit
| Party | Candidate | Votes | % | |
|---|---|---|---|---|
| Republican | Josh Barnett | 15,223 | 100.0 | |
| Total votes | 15,223 | 100.0 | ||
General election edit
Predictions edit
| Source | Ranking | As of |
|---|---|---|
| The Cook Political Report[37] | Safe D | November 2, 2020 |
| Inside Elections[38] | Safe D | October 28, 2020 |
| Sabato's Crystal Ball[39] | Safe D | November 2, 2020 |
| Daily Kos[40] | Safe D | November 2, 2020 |
| RCP[41] | Safe D | November 2, 2020 |
| Decision Desk HQ[42] | Safe D | November 3, 2020 |
| 538[43] | Safe D | November 3, 2020 |
| Elections Daily[44] | Safe D | November 1, 2020 |
| CNN[45] | Safe D | November 1, 2020 |
| Politico[46] | Safe D | November 2, 2020 |
| Niskanen[47] | Safe D | June 7, 2020 |
Results edit
| Party | Candidate | Votes | % | |
|---|---|---|---|---|
| Democratic | Ruben Gallego (incumbent) | 165,452 | 76.7 | |
| Republican | Josh Barnett | 50,226 | 23.3 | |
| Write-in | 54 | 0.0 | ||
| Total votes | 215,732 | 100.0 | ||
| Democratic hold | ||||
District 8 edit
| |||||||||||||||||
 Precinct results Lesko: 50–60% 60–70% 70–80% Muscato: 50–60% 60–70% No votes | |||||||||||||||||
| |||||||||||||||||

The 8th district encompasses the western and northwestern suburbs of Phoenix, taking in Surprise, Peoria, Litchfield Park, Anthem, northern Glendale, and parts of North Phoenix, including North Gateway and Rio Vista. The incumbent was Republican Debbie Lesko, who was re-elected with 55.5% of the vote in 2018.[3]
Republican primary edit
Candidates edit
Declared edit
- Debbie Lesko, incumbent U.S. Representative
Endorsements edit
- Organizations
- 60 Plus Association[93]
- American Conservative Union[93]
- Center for Arizona Policy[93]
- Concerned Women for America[93]
- Freedom Caucus[93]
- Maggie's List[93]
- National Federation of Independent Business[93]
- National Right to Life Committee[93]
- RightNOW Women[93]
- Susan B. Anthony List[93]
- United States Chamber of Commerce[93]
Primary results edit
| Party | Candidate | Votes | % | |
|---|---|---|---|---|
| Republican | Debbie Lesko (incumbent) | 105,630 | 100.0 | |
| Total votes | 105,630 | 100.0 | ||
Democratic primary edit
Candidates edit
Declared edit
- Michael Muscato, gym owner[94]
- Bob Musselwhite, former Litchfield Park city manager and councilman[95]
- Bob Olsen, attorney[96]
Declined edit
- Hiral Tipirneni, physician and nominee for Arizona's 8th congressional district in 2018 (running for Arizona's 6th congressional district)[75]
Endorsements edit
- Organizations
- Labor unions
- Organizations
- Labor unions
- American Federation of State, County and Municipal Employees – Locals 2384 and 3282[98]
- International Brotherhood of Electrical Workers – Local 266[98]
Primary results edit
| Party | Candidate | Votes | % | |
|---|---|---|---|---|
| Democratic | Michael Muscato | 35,898 | 54.3 | |
| Democratic | Bob Olsen | 20,534 | 31.1 | |
| Democratic | Bob Musselwhite | 9,575 | 14.5 | |
| Democratic | Kyle Martin (write-in) | 45 | 0.1 | |
| Total votes | 66,052 | 100.0 | ||
General election edit
Predictions edit
| Source | Ranking | As of |
|---|---|---|
| The Cook Political Report[37] | Safe R | November 2, 2020 |
| Inside Elections[38] | Safe R | October 28, 2020 |
| Sabato's Crystal Ball[39] | Safe R | November 2, 2020 |
| Daily Kos[40] | Safe R | November 2, 2020 |
| RCP[41] | Safe R | November 2, 2020 |
| Decision Desk HQ[42] | Safe R | November 3, 2020 |
| 538[43] | Safe R | November 3, 2020 |
| Elections Daily[44] | Safe R | November 1, 2020 |
| CNN[45] | Safe R | November 1, 2020 |
| Politico[46] | Likely R | November 2, 2020 |
| Niskanen[47] | Safe R | June 7, 2020 |
Results edit
| Party | Candidate | Votes | % | |
|---|---|---|---|---|
| Republican | Debbie Lesko (incumbent) | 251,633 | 59.6 | |
| Democratic | Michael Muscato | 170,816 | 40.4 | |
| Write-in | 18 | 0.0 | ||
| Total votes | 422,467 | 100.0 | ||
| Republican hold | ||||
District 9 edit
| |||||||||||||||||
 Precinct results Stanton: 50–60% 60–70% 70–80% 80–90% Giles: 50–60% No votes | |||||||||||||||||
| |||||||||||||||||


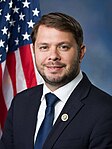
The 9th district is based in the Phoenix metro, and includes Tempe, southern Scottsdale, western Mesa, northwestern Chandler, and southern Phoenix, containing Ahwatukee and Camelback East. The incumbent was Democrat Greg Stanton, who was elected with 61.1% of the vote in 2018.[3]
Democratic primary edit
Candidates edit
Declared edit
- Greg Stanton, incumbent U.S. Representative
Primary results edit
| Party | Candidate | Votes | % | |
|---|---|---|---|---|
| Democratic | Greg Stanton (incumbent) | 83,443 | 100.0 | |
| Total votes | 83,443 | 100.0 | ||
Republican primary edit
Candidates edit
Declared edit
- Dave Giles, businessman, candidate for Arizona's 9th congressional district in 2018 and nominee in 2016[99]
- Sam Huang, Chandler city councilman[100]
- Nicholas Tutora, pharmacist[101]
Primary results edit
| Party | Candidate | Votes | % | |
|---|---|---|---|---|
| Republican | Dave Giles | 28,461 | 53.7 | |
| Republican | Sam Huang | 12,527 | 23.6 | |
| Republican | Nicholas Tutora | 12,053 | 22.7 | |
| Total votes | 53,041 | 100.0 | ||
Independents edit
Candidates edit
Withdrawn edit
- Irina Baroness von Behr, Republican candidate for Arizona's 9th congressional district in 2018[100][102]
General election edit
Predictions edit
| Source | Ranking | As of |
|---|---|---|
| The Cook Political Report[37] | Safe D | November 2, 2020 |
| Inside Elections[38] | Safe D | October 28, 2020 |
| Sabato's Crystal Ball[39] | Safe D | November 2, 2020 |
| Daily Kos[40] | Safe D | November 2, 2020 |
| RCP[41] | Safe D | November 2, 2020 |
| Decision Desk HQ[42] | Safe D | November 3, 2020 |
| 538[43] | Safe D | November 3, 2020 |
| Elections Daily[44] | Safe D | November 1, 2020 |
| CNN[45] | Safe D | November 1, 2020 |
| Politico[46] | Safe D | November 2, 2020 |
| Niskanen[47] | Safe D | June 7, 2020 |
Results edit
| Party | Candidate | Votes | % | |
|---|---|---|---|---|
| Democratic | Greg Stanton (incumbent) | 217,094 | 61.6 | |
| Republican | Dave Giles | 135,180 | 38.4 | |
| Total votes | 352,274 | 100.0 | ||
| Democratic hold | ||||
See also edit
Notes edit
- Partisan clients
- General notes
References edit
- ^ "For the First Time Since 1990, Arizona Has a Democratic-Republican Monopoly for all Congressional Races". Ballot Access News. September 13, 2020. Archived from the original on September 13, 2020. Retrieved September 13, 2020.
- ^ Johnson, Cheryl L. (February 28, 2019). "Statistics of the Congressional Election of November 3, 2020". Clerk of the U.S. House of Representatives.
- ^ a b c d e f g h i Wasserman, David; Flinn, Ally (November 7, 2018). "2018 House Popular Vote Tracker". Cook Political Report. Archived from the original on April 3, 2019. Retrieved February 15, 2019.
- ^ Skabelund, Adrian (February 7, 2019). "Congressman O'Halleran announces 2020 re-election bid". Arizona Daily Sun. Retrieved February 15, 2019.
- ^ Skabelund, Adrian (January 16, 2019). "Former councilmember Eva Putzova to run for US House seat in 2020". Arizona Daily Sun. Retrieved February 15, 2019.
- ^ Duda, Jeremy (August 19, 2019). "Former lawmaker McGuire challenging O'Halleran in Dem primary". AZ Mirror. Retrieved August 20, 2019.
- ^ "Delina DiSanto, Barbara McGuire featured speakers at San Tan Valley Democrats Aug. 15 meeting". Queen Creek Independent. August 13, 2020. Retrieved September 18, 2020.
- ^ Bell, David (July 18, 2019). "Shedd joins Taylor in seeking GOP nom for Congress". Retrieved August 13, 2019.
- ^ "Larry Williams (Arizona)". Ballotpedia. Retrieved August 1, 2020.
- ^ Muller, Tiffany (September 30, 2019). "End Citizens United Endorses Seventeen House Democrats". End Citizens United.
- ^ a b "Project30". High School Democrats of America. Archived from the original on September 13, 2020. Retrieved August 27, 2020.
- ^ "HRC in Arizona". Human Rights Campaign. Retrieved August 1, 2020.
- ^ "Jewish Dems roll out new round of congressional endorsements". Jewish Insider. June 17, 2020. Retrieved August 1, 2020.
- ^ "LCV Action Fund Endorses Tom O'Halleran for Re-Election". League of Conservation Voters. July 14, 2020. Retrieved August 1, 2020.
- ^ "Endorsements – NARAL Pro-Choice America". NARAL Pro-Choice America.
- ^ a b "2020 Endorsements". plannedparenthoodaction.org. Planned Parenthood Action Fund. Archived from the original on November 15, 2019. Retrieved January 27, 2020.
- ^ "Eva Putzova". Brand New Congress. October 22, 2019. Archived from the original on October 23, 2019. Retrieved October 23, 2019.
- ^ a b c d "Eva Putzova for Congress". Eva Putzova for Congress. Retrieved March 19, 2020.
- ^ "Friends of the Earth Action Endorses Progressive Challengers Ahead of Super Tuesday". Common Dreams. Retrieved August 1, 2020.
- ^ "Endorsed Candidates". National Women's Political Caucus. Retrieved January 9, 2021.
- ^ a b "PeaceVoter 2020 Endorsements". Peace Action. Archived from the original on March 20, 2020. Retrieved March 19, 2020.
- ^ "2020 Endorsements". PDA. Archived from the original on May 20, 2020. Retrieved March 19, 2020.
- ^ "Virtual Fundraiser for Eva Putzova with Special Guest Marianne Williamson". Coconino County Democrats. May 21, 2020. Archived from the original on September 18, 2021. Retrieved March 1, 2021.
- ^ a b c d e f g h i j k l m n o "State of Arizona Official Canvass – 2020 Primary Election" (PDF). Arizona Secretary of State. Retrieved September 11, 2020.
- ^ Bell, David (July 18, 2019). "Shedd joins Taylor in seeking GOP nom for Congress". Eastern Arizona Courier. Retrieved July 18, 2019.
- ^ Skabelund, Adrian (October 31, 2019). "Four Republicans are looking to flip CD1 but they will face each other first". Retrieved November 2, 2019.
- ^ Yerian, Loretta (October 8, 2019). "John Moore announces run for U.S. House of Representatives". Williams News. Retrieved October 9, 2019.
- ^ "Williams Mayor John Moore suspends congressional campaign to focus on coronavirus". Arizona Daily Sun. April 8, 2020.
- ^ "Doyel Shamley". Ballotpedia.
- ^ Johnson, Jon (May 15, 2019). "Safford City Councilor Chris Taylor announces bid for Congress". The Gila Herald. Retrieved May 16, 2019.
- ^ "Safford city councilman suspends congressional campaign following heroin relapse and overdose". KSAZ-TV. February 24, 2020. Retrieved March 4, 2020.
- ^ "Former Safford Councilman Taylor endorses Reidhead for Congress". The Gila Herald. April 6, 2020. Retrieved March 29, 2024.
- ^ Stone, Kevin (October 15, 2019). "Curt Schilling decides against running for Congress in Arizona". KTAR News. Retrieved October 15, 2019.
- ^ Hulsizer, Isabella (August 31, 2019). "Tiffany Shedd picks up Jon Kyl's backing in race for Congress as she discourages Curt Schilling run". The Arizona Republic. Archived from the original on March 29, 2024. Retrieved March 29, 2024.
- ^ Surma, Katie (February 6, 2020). "House Republican leader Kevin McCarthy endorses Tiffany Shedd in CD 1". The Arizona Republic. Archived from the original on March 29, 2024. Retrieved March 29, 2024.
- ^ "Tiffany Shedd – Susan B. Anthony List". Archived from the original on June 15, 2020. Retrieved June 14, 2020.
- ^ a b c d e f g h i "2020 House Race Ratings for November 2, 2020". The Cook Political Report. Retrieved April 5, 2021.
- ^ a b c d e f g h i "2020 House Ratings". House Ratings. The Rothenberg Political Report. Retrieved April 5, 2021.
- ^ a b c d e f g h i "2020 House race ratings". Sabato's Crystal Ball. Retrieved April 5, 2021.
- ^ a b c d e f g h i "2020 House Race Ratings". Daily Kos Elections. Retrieved April 5, 2021.
- ^ a b c d e f g h i "Battle for House 2020". RCP. Retrieved April 5, 2021.
- ^ a b c d e f g h i "2020 House Election Model". Øptimus Consulting. Decision Desk HQ. November 3, 2020. Retrieved July 31, 2022.
- ^ a b c d e f g h i "2020 House Forecast". FiveThirtyEight. November 3, 2020. Retrieved November 3, 2020.
- ^ a b c d e f g h i "2020 House Race Ratings". Elections Daily. Retrieved November 1, 2021.
- ^ a b c d e f g h i "House Race Ratings". cnn.com. Cable News Network. Archived from the original on November 1, 2020. Retrieved September 15, 2023.
- ^ a b c d e f g h i "2020 Election Forecast". Politico. April 5, 2021.
- ^ a b c d e f g h i "2020 Negative Partisanship and the 2020 Congressional Elections". Niskanen Center. April 28, 2020. Archived from the original on June 21, 2020. Retrieved July 4, 2020.
- ^ a b c d e f g h i "State of Arizona – Official Canvass – 2020 General Election" (PDF). Arizona Secretary of State. Retrieved November 30, 2020.
- ^ a b c Hansen, Ronald J. (June 21, 2019). "Who's running for Congress in Arizona? Here are all the 2020 federal candidates". The Arizona Republic. Retrieved June 22, 2019.
- ^ "Peter Quilter for Congress". Quilter for Congress. Archived from the original on February 13, 2020. Retrieved February 13, 2020.
- ^ a b c d e f g h i j k l m n o p q r s "OUR SUPPORTERS". Ann Kirkpatrick for Congress. Retrieved June 4, 2020.
- ^ Bell, David (March 18, 2019). "Dragoon's Schmidt, Sierra Vista's Martin announce GOP run for Congress". Arizona Range News. Archived from the original on May 16, 2019. Retrieved May 16, 2019.
- ^ Sayers, Justin (July 25, 2020). "Republicans, Democrat challenge Kirkpatrick for historically competitive U.S. Congress seat". Arizona Daily Star. Retrieved July 31, 2020.
- ^ "Mike Ligon". Ballotpedia.
- ^ Hansen, Ronald J. (July 11, 2019). "Former UA lobbyist Shay Stautz seeks to challenge Rep. Ann Kirkpatrick". The Arizona Republic. Retrieved July 18, 2019.
- ^ "Shay Stautz – former 2020 Candidate for Congress – Congress AZ 02". LinkedIn. Retrieved July 21, 2020.
- ^ "Justine Wadsack". Justine Wadsack. Retrieved January 10, 2020.
- ^ Wadsack, Justine [@Wadsack4Arizona] (February 14, 2020). "Today, I withdrew from the crowded #AZ02 race to run for Arizona's #LD10 Senate seat, of which Sen. David Bradley terms-out of in 2020. I did so in response to Bradley's #SB1625 (SB1624 & SB1626) gun grab bills. Help me flip this seat RED so I can protect #2A! #Wadsack4Arizona" (Tweet). Retrieved June 4, 2020 – via Twitter.
- ^ "Raúl Grijalva | Leading Progressive Democrat". Raúl Grijalva, Leading Progressive Democrat.
- ^ Ferguson, Joe (November 15, 2019). "Political Notebook: Congressional candidates announce plans as we head toward 2020". Tucson.com. Retrieved January 3, 2020.
- ^ Ingram, Paul (August 8, 2019). "New GOP CD3 candidate attacks 'Cartel Congressman' Grijalva, claims 'intoxication' on the job". Tucson Sentinel. Retrieved September 6, 2019.
- ^ "Steve Ronnebeck". Ballotpedia.
- ^ "Dr. Paul Gosar for Congress". Dr. Paul Gosar for Congress.
- ^ Hecht, Jon (December 26, 2019). "Ward aims to unseat Gosar in GOP Congressional primary". Journal AZ. Archived from the original on December 30, 2019. Retrieved December 30, 2019.
- ^ DiSanto, Delina (December 26, 2019). "Delina 2020". Delina 2020.
- ^ Krejci, Cleo (July 24, 2020). "Who is running in Congressional District 4?". Arizona Republic. Retrieved July 31, 2020.
- ^ "Andy Biggs". Ballotpedia.
- ^ "Jon Ireland for Congress". Retrieved December 14, 2019.
- ^ a b Hansen, Ronald J. (April 6, 2020). "Here are the Arizona congressional candidates who filed to make ballot". Arizona Republic.
- ^ Hansen, Ronald J. (October 16, 2019). "Rep. David Schweikert's campaign flounders with donors again". Retrieved November 2, 2019.
- ^ "David Schweikert (AZ-06)". Club for Growth. Retrieved February 29, 2020.
- ^ "Karl Gentles Enters Arizona Congressional Race". phxsoul. Archived from the original on October 21, 2019. Retrieved November 16, 2019.
- ^ Stone, Kevin (April 17, 2019). "Anita Malik joins Democratic race to unseat US Rep. David Schweikert". KTAR. Retrieved April 17, 2019.
- ^ Montellaro, Zach (April 19, 2019). "2020ers talk Mueller report, but how are downballot candidates responding?". Politico Pro. Retrieved April 19, 2019.
Democrat Stephanie Rimmer, a business owner, said she is running in AZ-06.
- ^ a b "Democrat Hiral Tipirneni to run for Congress in new district". KGUN. Associated Press. April 2, 2019. Retrieved April 2, 2019.
- ^ a b Hansen, Ronald J. (June 19, 2019). "Hiral Tipirneni endorsed by Reps. Ann Kirkpatrick, Tom O'Halleran". AZ Central.
- ^ "Former President Barack Obama Endorses Three Indian American Candidates in First Wave of Endorsements". India West. August 4, 2020. Archived from the original on December 16, 2020. Retrieved March 1, 2021.
- ^ a b c d e f g h i "Arizona Legislative Leaders Endorse Indian American Hiral Tipirneni for 6th Congressional District". India West. September 19, 2019. Retrieved March 1, 2021.[permanent dead link]
- ^ a b c d e f g h i j k l m "Endorsements". Hiral for Congress. Archived from the original on May 5, 2020. Retrieved April 19, 2020.
- ^ "Endorsed Candidates". 314 Action. Archived from the original on April 4, 2020. Retrieved December 28, 2019.
- ^ "2020 Primary Election Candidates & Endorsements". stonewalldemsaz.org. Retrieved August 1, 2020.
- ^ "ASPIRE PAC ANNOUNCES ENDORSEMENT OF GINA ORTIZ JONES FOR TX-23 REPRESENTATIVE AND DR. HIRAL TIPIRNENI FOR AZ-06 REPRESENTATIVE". ASPIRE PAC. Archived from the original on March 27, 2020. Retrieved March 27, 2020.
- ^ Brown, Kris (December 11, 2019). "Brady Endorses Dr. Hiral Tipirneni: An Advocate for Common-Sense Gun Safety Policies". Brady.
- ^ Schriock, Stephanie (September 13, 2019). "EMILY's List Endorses Hiral Tipirneni in Arizona's 6th District". Emily' s List.
- ^ "End Citizens United Endorses Hiral Tipirneni For AZ-06". End Citizens United. September 16, 2019.
- ^ "2020 ENDORSED CANDIDATES". Gun Sense Voter.
- ^ "Human Rights Campaign Makes Endorsements to Expand the Pro-Equality Majority in Congress". June 4, 2020.
- ^ Sittenfeld, Tiernan (November 19, 2019). "LCV Action Fund Endorses Dr. Hiral Tipirneni for Congress". League of Conservation Voters.
- ^ Hogue, Ilyse (December 9, 2019). "NARAL Pro-Choice America Endorses Hiral Tipirneni for Congress". NARAL Pro-Choice America.
- ^ Montellaro, Zach (February 10, 2020). "Race to the finish in New Hampshire". Politico.
- ^ "Sierra Club #ClimateVoter Guide: Endorsements". Sierra Club.
- ^ Sanchez, Yvonne Wingett (March 25, 2019). "Rep. Ruben Gallego, averting primary brawl, won't run for the Senate". azcentral.com. Retrieved March 26, 2019.
- ^ a b c d e f g h i j k "ENDORSEMENTS". debbielesko. Retrieved June 4, 2020.
- ^ "Lesko misleads voters on Democrat's priorities, her record". Arizona Capitol Times. July 12, 2019. Retrieved August 18, 2019.
- ^ Haldiman, Philip (March 12, 2019). "Former Litchfield Park leader to run for U.S. Congress". Your Valley. Retrieved March 19, 2019.
- ^ Scanlon, Tom (July 26, 2020). "Meet the candidates for Congressional Dist. 8". The Glendale Star. Retrieved July 31, 2020.
- ^ a b c "ENDORSEMENTS". Muscato For Congress. Archived from the original on June 4, 2020. Retrieved June 4, 2020.
- ^ a b c d "Home". bobolsen2020.com. Retrieved August 1, 2020.[permanent dead link]
- ^ @Politics1com (December 19, 2018). "AZ CD-9: Business consultant & '16/'18 candidate Dave Giles (R) launches 2020 run vs Cong-elect Greg Stanton (D)" (Tweet). Retrieved March 22, 2019 – via Twitter.
- ^ a b Pineda, Paulina (July 30, 2019). "Chandler Councilman Sam Huang running for office in 9th Congressional District". Arizona Republic. Retrieved July 30, 2019.
- ^ Krejci, Cleo (July 21, 2020). "Who is running in Congressional District 9?". Arizona Republic. Retrieved July 31, 2020.
- ^ "Post made by Irina Baroness von Behl announcing decision to withdraw from 2020 race". Facebook. May 8, 2020. Retrieved June 3, 2020.
External links edit
- National Institute on Money in Politics; Campaign Finance Institute, "Arizona 2019 & 2020 Elections", OpenSecrets
|
Official campaign websites
|