


Summary
The 2020 United States presidential election in New Jersey was held on Tuesday, November 3, 2020, as part of the 2020 United States presidential election in which all 50 states plus the District of Columbia participated.[1] New Jersey voters chose electors to represent them in the Electoral College via a popular vote, pitting the Republican Party's nominee, incumbent President Donald Trump, and running mate Vice President Mike Pence against Democratic Party nominee, former Vice President Joe Biden, and his running mate California Senator Kamala Harris. New Jersey has 14 electoral votes in the Electoral College.[2]
| ||||||||||||||||||||||||||
| Turnout | ||||||||||||||||||||||||||
|---|---|---|---|---|---|---|---|---|---|---|---|---|---|---|---|---|---|---|---|---|---|---|---|---|---|---|
| ||||||||||||||||||||||||||


| ||||||||||||||||||||||||||
| ||||||||||||||||||||||||||

Biden carried New Jersey by 15.94%, making the state 11.49% more Democratic than the nation as a whole. Per exit polls by the Associated Press, Biden's victory came from a coalition of key Democratic constituencies, including 86% of Blacks, 76% of Asians, 72% of Hispanic and Latino Americans, and 50% of Whites.[3] Biden's strength with Asian Americans was evident in New Jersey, where Asians constituted 10.0% of the population in 2019.[4][5]
Biden flipped Gloucester County, which was reliably Democratic until Trump flipped it in 2016. He also became the first Democrat since Lyndon B. Johnson in 1964 to win Morris County, which Cory Booker won in the simultaneous senate election.[6] This also became the first presidential election since 2000 in which Salem County did not vote for the national winner.[12][13] Trump carried 255 of New Jersey's 565 municipalities, fewer than the 307 he carried in 2016, with Biden carrying the other 310.[14] Biden's 2.6 million votes is the most received by any candidate of either party in a presidential election in the state's history.
Primary elections edit
The primary elections were originally scheduled for June 2, 2020. In April, they were moved to July 7 due to concerns over the COVID-19 pandemic.[15] On May 15, 2020, Governor Phil Murphy signed an executive order declaring the primary election to become a primarily vote-by-mail election. Democratic and Republican voters will automatically receive a vote-by-mail ballot while unaffiliated and inactive voters will get a vote-by-mail application. Unaffiliated voters must declare their party in the application and send in to their respective county board of elections in order to vote and receive their primary election ballot. A limited number of polling stations in each county will be available on primary day for those who prefer to vote in person (including with provisional ballots if they're unable to obtain one) and for voters with disabilities.[16]
Republican primary edit
Incumbent President Donald Trump ran unopposed in the Republican primary.[17] The state has 49 delegates to the 2020 Republican National Convention.[18]
| Candidate | Votes | % | Delegates |
|---|---|---|---|
| Donald Trump | 457,212 | 100 | 49 |
| Total | 457,212 | 100.00 | 49 |
Democratic primary edit
| Candidate | Votes | % | Delegates[20] |
|---|---|---|---|
| Joe Biden | 814,188 | 84.92 | 121 |
| Bernie Sanders (withdrawn) | 140,412 | 14.65 | 5 |
| Uncommitted | 4,162 | 0.43 | |
| Total | 958,762 | 100% | 126 |
Green primary edit
| Candidate | Votes | Percentage[a] | National delegates |
|---|---|---|---|
| Howie Hawkins | 44 | 78.6% | 5 |
| Dario Hunter | 4 | 7.1% | 0 |
| Jesse Ventura | 3 | 5.4% | 0 |
| Sedinam Moyowasifza-Curry | 2 | 3.6% | 0 |
| Bernie Sanders | 2 | 3.6% | 0 |
| Kent Mesplay | 1 | 1.8% | 0 |
| Susan Buchser-Lochocki | 0 | 0% | 0 |
| Dennis Lambert | 0 | 0% | 0 |
| Chad Wilson | 0 | 0% | 0 |
| David Rolde | 0 | 0% | 0 |
| Total | 56 | 100.00% | 5 |
General election edit
Predictions edit
| Source | Ranking | As of |
|---|---|---|
| The Cook Political Report[22] | Solid D | October 28, 2020 |
| Inside Elections[23] | Safe D | October 16, 2020 |
| Sabato's Crystal Ball[24] | Safe D | October 8, 2020 |
| Politico[25] | Safe D | September 8, 2020 |
| RCP[26] | Likely D | August 3, 2020 |
| Niskanen[27] | Safe D | July 26, 2020 |
| CNN[28] | Safe D | August 3, 2020 |
| The Economist[29] | Safe D | September 2, 2020 |
| CBS News[30] | Likely D | September 27, 2020 |
| 270towin[31] | Safe D | August 2, 2020 |
| ABC News[32] | Safe D | July 31, 2020 |
| NPR[33] | Likely D | October 30, 2020 |
| NBC News[34] | Likely D | August 6, 2020 |
| 538[35] | Solid D | September 27, 2020 |
| Fox News[36] | Likely D | November 2, 2020 |
Polling edit
Graphical summary edit
Aggregate polls edit
| Source of poll aggregation |
Dates administered |
Dates updated |
Joe Biden Democratic |
Donald Trump Republican |
Other/ Undecided [b] |
Margin |
|---|---|---|---|---|---|---|
| 270 to Win | October 9 – November 2, 2020 | November 3, 2020 | 56.5% | 37.3% | 6.2% | Biden +19.2 |
| Real Clear Politics | September 4 – October 13, 2020 | November 3, 2020 | 54.7% | 37.3% | 8.0% | Biden +17.4 |
| FiveThirtyEight | until November 2, 2020 | November 3, 2020 | 58.4% | 37.9% | 3.7% | Biden +20.4 |
| Average | 56.5% | 37.5% | 7.8% | Biden +19.0 | ||
- Polls
| Poll source | Date(s) administered |
Sample size[c] |
Margin of error |
Donald Trump Republican |
Joe Biden Democratic |
Jo Jorgensen Libertarian |
Howie Hawkins Green |
Other | Undecided |
|---|---|---|---|---|---|---|---|---|---|
| SurveyMonkey/Axios | Oct 20 – Nov 2, 2020 | 3,870 (LV) | ± 2% | 38%[d] | 59% | - | - | – | – |
| Research Co. | Oct 31 – Nov 1, 2020 | 450 (LV) | ± 4.6% | 40% | 59% | - | - | 1%[e] | 5% |
| Swayable Archived November 13, 2020, at the Wayback Machine | Oct 27 – Nov 1, 2020 | 324 (LV) | ± 7.2% | 40% | 59% | 1% | 0% | – | – |
| SurveyMonkey/Axios | Oct 1–28, 2020 | 6,472 (LV) | – | 37% | 60% | - | - | – | – |
| Swayable | Oct 23–26, 2020 | 386 (LV) | ± 6.5% | 38% | 62% | 0% | 0% | – | – |
| Rutgers-Eagleton | Oct 19–24, 2020 | 834 (LV) | ± 4% | 37% | 59% | - | - | 1%[f] | 1% |
| Stockton College | Oct 7–13, 2020 | 721 (LV) | ± 3.7% | 36% | 56% | - | - | – | – |
| DKC Analytics/Brach Eichler | Oct 5–13, 2020 | 500 (LV) | ± 4.4% | 34% | 56% | - | - | 10%[g] | – |
| Fairleigh Dickinson University | Sep 30 – Oct 5, 2020 | 582 (LV) | ± 4.6% | 38% | 53% | - | - | 5%[h] | 4% |
| SurveyMonkey/Axios | Sep 1–30, 2020 | 2,952 (LV) | – | 37% | 60% | - | - | – | 3% |
| DKC Analytics/Brach Eichler | Sep 8–16, 2020 | 501 (LV) | ± 4.4% | 38% | 52% | - | - | 10%[g] | – |
| Emerson College | Sep 4–7, 2020 | 500 (LV) | ± 4.4% | 40%[i] | 58% | - | - | 2%[j] | – |
| SurveyMonkey/Axios | Aug 1–31, 2020 | 2,309 (LV) | – | 40% | 57% | - | - | – | 3% |
| DKC Analytics/Brach Eichler | Aug 5–13, 2020 | 500 (LV) | ± 4.383% | 33% | 52% | - | - | 15%[k] | – |
| SurveyMonkey/Axios | Jul 1–31, 2020 | 2,426 (LV) | – | 37% | 61% | - | - | – | 2% |
| Pollfish/DKC Analytics/Brach Eichler | Jul 7–12, 2020 | 500 (LV) | ± 4.383% | 33% | 51% | - | - | 7%[l] | 8% |
| SurveyMonkey/Axios | Jun 8–30, 2020 | 1,110 (LV) | – | 37% | 61% | - | - | – | 3% |
| Quinnipiac | Apr 30 – May 4, 2020 | 941 (RV) | ± 3.2% | 35% | 54% | - | - | 3%[m] | 8% |
| Rutgers-Eagleton | Apr 22 – May 2, 2020 | 689 (RV) | ± 4.2% | 33% | 56% | - | - | 5%[n] | 7% |
| Monmouth University | Apr 16–19, 2020 | 635 (RV) | ± 3.9% | 38% | 54% | - | - | 2% | 6% |
| Fairleigh Dickinson University | Feb 12–16, 2020 | 715 (RV) | – | 35% | 53% | - | - | – | – |
Former candidates
| ||||||||||||||||||||||||||||||||||||||||||||||||||||||||||||||||||||||||||||||||
|---|---|---|---|---|---|---|---|---|---|---|---|---|---|---|---|---|---|---|---|---|---|---|---|---|---|---|---|---|---|---|---|---|---|---|---|---|---|---|---|---|---|---|---|---|---|---|---|---|---|---|---|---|---|---|---|---|---|---|---|---|---|---|---|---|---|---|---|---|---|---|---|---|---|---|---|---|---|---|---|---|
|
Results edit

-Blue municipalities won by Biden
-Red municipalities won by Trump
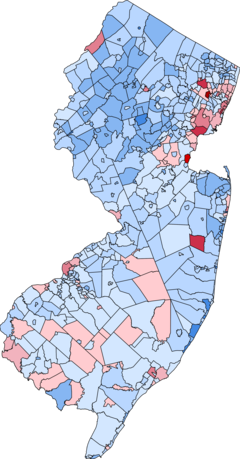
-Blue municipalities swung towards Biden
-Red municipalities swung towards Trump
| Party | Candidate | Votes | % | ±% | |
|---|---|---|---|---|---|
| Democratic | Joseph R. Biden Jr. Kamala D. Harris |
2,608,400 | 57.34% | +1.88% | |
| Republican | Donald Trump Mike Pence |
1,883,313 | 41.40% | +0.05% | |
| Libertarian | Jo Jorgensen Spike Cohen |
31,677 | 0.70% | −1.17% | |
| Green | Howie Hawkins Angela Walker |
14,202 | 0.31% | −0.67% | |
| Unity | Bill Hammons Eric Bodenstab |
3,255 | 0.07% | ±0.00% | |
| Constitution | Don Blankenship William Mohr |
2,954 | 0.06% | −0.10% | |
| Socialism and Liberation | Gloria La Riva Sunil Freeman |
2,928 | 0.06% | +0.02% | |
| Alliance | Rocky De La Fuente Darcy Richardson |
2,728 | 0.06% | +0.01% | |
| Total votes | 4,549,353 | 100.00% | |||
Results by county edit
| County | Joe Biden Democratic |
Donald Trump Republican |
Various candidates Other parties |
Margin | Total votes cast | ||||
|---|---|---|---|---|---|---|---|---|---|
| # | % | # | % | # | % | # | % | ||
| Atlantic | 73,808 | 52.71% | 64,438 | 46.02% | 1,785 | 1.27% | 9,370 | 6.69% | 140,031 |
| Bergen | 285,967 | 57.44% | 204,417 | 41.06% | 7,454 | 1.50% | 81,550 | 16.38% | 497,838 |
| Burlington | 154,595 | 58.86% | 103,345 | 39.35% | 4,710 | 1.79% | 51,250 | 19.51% | 262,650 |
| Camden | 175,065 | 65.91% | 86,207 | 32.46% | 4,327 | 1.63% | 88,858 | 33.45% | 265,599 |
| Cape May | 23,941 | 41.33% | 33,158 | 57.24% | 834 | 1.43% | -9,217 | -15.91% | 57,933 |
| Cumberland | 32,742 | 52.32% | 28,952 | 46.27% | 881 | 1.41% | 3,790 | 6.05% | 62,575 |
| Essex | 266,820 | 77.07% | 75,475 | 21.80% | 3,892 | 1.13% | 191,345 | 55.27% | 346,187 |
| Gloucester | 86,702 | 49.99% | 83,340 | 48.05% | 3,411 | 1.96% | 3,362 | 1.94% | 173,453 |
| Hudson | 181,452 | 72.45% | 65,698 | 26.23% | 3,308 | 1.32% | 115,754 | 46.22% | 250,458 |
| Hunterdon | 39,457 | 46.60% | 43,153 | 50.96% | 2,063 | 2.44% | -3,696 | -4.36% | 84,673 |
| Mercer | 122,532 | 69.14% | 51,641 | 29.14% | 3,050 | 1.72% | 70,891 | 40.00% | 177,223 |
| Middlesex | 226,250 | 60.22% | 143,467 | 38.19% | 5,975 | 1.59% | 82,783 | 22.03% | 375,692 |
| Monmouth | 181,291 | 47.91% | 191,808 | 50.69% | 5,291 | 1.40% | -10,517 | -2.78% | 378,390 |
| Morris | 153,881 | 51.14% | 141,134 | 46.90% | 5,902 | 1.96% | 12,747 | 4.24% | 300,917 |
| Ocean | 119,456 | 34.85% | 217,740 | 63.53% | 5,550 | 1.62% | -98,274 | -28.68% | 342,746 |
| Passaic | 129,097 | 57.55% | 92,009 | 41.02% | 3,224 | 1.43% | 37,088 | 16.53% | 224,330 |
| Salem | 14,479 | 42.53% | 18,827 | 55.31% | 736 | 2.16% | -4,348 | -12.78% | 34,042 |
| Somerset | 111,173 | 59.49% | 71,996 | 38.52% | 3,722 | 1.99% | 39,177 | 20.97% | 186,891 |
| Sussex | 34,481 | 39.03% | 51,701 | 58.52% | 2,173 | 2.45% | -17,220 | -19.49% | 88,355 |
| Union | 170,310 | 67.01% | 80,038 | 31.49% | 3,794 | 1.50% | 90,272 | 35.52% | 254,142 |
| Warren | 24,901 | 40.78% | 34,769 | 56.95% | 1,387 | 2.27% | -9,868 | -16.17% | 61,057 |
| Totals | 2,608,400 | 57.14% | 1,883,313 | 41.25% | 73,469 | 1.61% | 725,087 | 15.89% | 4,565,182 |


Counties that flipped from Republican to Democratic edit
- Gloucester (largest municipality: Washington Township)
- Morris (largest municipality: Parsippany)
By congressional district edit
Biden won 9 out of the 12 congressional districts in New Jersey. Trump won 3, including one that elected a Democrat.[38]
| District | Biden | Trump | Representative |
|---|---|---|---|
| 1st | 62.1% | 36.6% | Donald Norcross |
| 2nd | 47.9% | 50.8% | Jeff Van Drew |
| 3rd | 49.2% | 49.4% | Andy Kim |
| 4th | 44.1% | 54.6% | Chris Smith |
| 5th | 51.9% | 46.7% | Josh Gottheimer |
| 6th | 57.2% | 41.5% | Frank Pallone Jr. |
| 7th | 54.2% | 44.3% | Tom Malinowski |
| 8th | 71.8% | 27.2% | Albio Sires |
| 9th | 62.2% | 36.8% | Bill Pascrell |
| 10th | 84.2% | 15.0% | Donald Payne Jr. |
| 11th | 52.7% | 46.0% | Mikie Sherrill |
| 12th | 67.3% | 31.4% | Bonnie Watson Coleman |
Analysis edit
As the polls predicted, Joe Biden won New Jersey by a wide margin. Biden ran up huge margins in the state's major cities such as Newark, Jersey City, Paterson, Trenton, Atlantic City, Camden, and several others. In addition to carrying all the counties that Clinton won in 2016, Biden flipped Gloucester County, which was a reliably blue county before Trump won it in 2016. Biden also won Morris County, which had never voted Democratic in any presidential race since 1964; Senator Cory Booker concurrently won Morris County in his reelection victory as well. In neighboring Hunterdon County, Biden came within 4.4 points of victory despite the county being a reliably Republican stronghold as well. Biden recorded the highest share of the vote in Sussex and Hunterdon Counties for a Democrat since 1964, the last time either county voted Democratic.
Trump, meanwhile, performed strongly in Ocean County, which is reliably red. He also did well in Sussex and Warren counties, two northern rural counties that have not voted Democratic since 1964. Salem County, which Trump flipped in 2016, remained in his column and he also narrowly held on to Monmouth County, which has not voted Democratic since 2000 but where the margins have always been somewhat close. He also improved in the urban counties of Essex and Hudson, due to noticeable improvements in several of those counties' most populated cities, such as Jersey City and Newark.[40]
Ultimately, Trump carried 255 of New Jersey's 565 municipalities, less than the 307 he carried in 2016, with Biden carrying the other 310. Compared to their 2016 margins, 471 of New Jersey's 565 municipalities swung towards Biden in this election. However, Trump was able to improve significantly upon his 2016 margins in many of New Jersey's most heavily populated cities, which kept the statewide margin within 2% of the 2016 results. For example, in New Jersey's most populated city, Newark, Trump nearly doubled his 2016 share of the vote, going from 6.63% to 12.25% of the vote.[40] This was the best Republican performance in Newark since George W. Bush received 12.8% of the vote in 2004.[41] Other populated cities, such as Paterson and Camden, posted similarly notable shifts towards the GOP, with much of the rest of the state shifting towards the Democrats instead.
See also edit
- United States presidential elections in New Jersey
- Presidency of Joe Biden
- 2020 New Jersey elections
- Bilingual elections requirement for New Jersey (per Voting Rights Act Amendments of 2006)[42]
- 2020 United States presidential election
- 2020 Democratic Party presidential primaries
- 2020 Republican Party presidential primaries
- 2020 United States elections
Notes edit
- ^ This primary was conducted under a system in which each person could cast a vote for more than one candidate, therefore percentages reflect the percentage of voters that approved of each candidate, and as a result do not add up to 100%.
- ^ Calculated by taking the difference of 100% and all other candidates combined.
- ^ Key:
A – all adults
RV – registered voters
LV – likely voters
V – unclear - ^ Overlapping sample with the previous SurveyMonkey/Axios poll, but more information available regarding sample size
- ^ "Someone else" with 1%
- ^ "Neither" with 1%; "Someone else" with 0%
- ^ a b "Another candidate or unsure" with 10%
- ^ "Refused" with 4%; "Someone else" with 1%
- ^ With voters who lean towards a given candidate
- ^ "Someone else" with 2%
- ^ "Another candidate or unsure" with 15%
- ^ "For another candidate" with 7%
- ^ "Someone else" with 2%; would not vote with 1%
- ^ "Neither" with 4%; "someone else" with 1%
References edit
- ^ Kelly, Ben (August 13, 2018). "US elections key dates: When are the 2018 midterms and the 2020 presidential campaign?". The Independent. Archived from the original on August 2, 2018. Retrieved January 3, 2019.
- ^ "Distribution of Electoral Votes". National Archives and Records Administration. Retrieved January 3, 2019.
- ^ "New Jersey Voter Surveys: How Different Groups Voted". The New York Times. November 3, 2020. ISSN 0362-4331. Retrieved November 9, 2020.
- ^ Mehta, Dhrumil (September 18, 2020). "How Asian Americans Are Thinking About The 2020 Election". FiveThirtyEight. Retrieved November 9, 2020.
- ^ "QuickFacts New Jersey". United States Census Bureau. Retrieved May 21, 2021.
- ^ Homan, Timothy R. (November 11, 2020). "On The Trail: Biden wins America's economic engines". The Hill. Retrieved November 15, 2020.
- ^ "Salem County General Election Results: Presidential (2016)" (PDF). New Jersey Division of Elections. Retrieved December 18, 2020.
- ^ "General Election Results Salem County: Presidential (2012)" (PDF). New Jersey Division of Elections. Retrieved December 18, 2020.
- ^ "General Election Presidential Results: Salem County (2008)" (PDF). New Jersey Division of Elections. Retrieved December 18, 2020.
- ^ "Salem County Presidential Results (2004)" (PDF). New Jersey Division of Elections. Retrieved December 18, 2020.
- ^ "Official General Election Results: President (2000)" (PDF). New Jersey Division of Elections. Retrieved December 18, 2020.
- ^ [7][8][9][10][11]
- ^ "General Election Results: President (1992)" (PDF). New Jersey Division of Elections. Retrieved December 20, 2020.
- ^ "These 53 N.J. Towns flipped from Trump to Biden in 2020". MSN. Archived from the original on August 1, 2021. Retrieved April 6, 2024.
- ^ "New Jersey moves primary elections to July". The Hill. April 8, 2020.
- ^ "N.J.'s July 7 primary election will be mostly vote-by-mail during coronavirus pandemic, Murphy says". May 15, 2020.
- ^ "Trump, Biden (no surprise) prevail in N.J.'s presidential primary". NJ.com. July 7, 2020.
- ^ "New Jersey Republican Delegation 2020". The Green Papers. Retrieved June 23, 2020.
- ^ "Official Election Results -AMENDED-: Candidates for Democratic District Delegates/Alternate District Delegates For- July 7, 2020- PRIMARY ELECTION" (PDF). New Jersey Division of Elections. Retrieved September 20, 2020.
- ^ "2020 Presidential Primaries, Caucuses, and Conventions: New Jersey Democrat". The Green Papers. Retrieved July 13, 2020.
- ^ "2020 Convention - [Part 1] Public Office Voting Results". Twitter. Retrieved May 9, 2020.
- ^ "2020 POTUS Race ratings" (PDF). The Cook Political Report. Retrieved October 31, 2020.
- ^ "POTUS Ratings | Inside Elections". insideelections.com. Retrieved May 21, 2019.
- ^ "Larry J. Sabato's Crystal Ball » 2020 President". crystalball.centerforpolitics.org. Retrieved May 21, 2019.
- ^ "2020 Election Forecast". Politico. November 19, 2019.
- ^ "Battle for White House". RCP. April 19, 2019.
- ^ 2020 Bitecofer Model Electoral College Predictions Archived April 23, 2020, at the Wayback Machine, Niskanen Center, March 24, 2020, retrieved: April 19, 2020.
- ^ David Chalian; Terence Burlij (June 11, 2020). "Road to 270: CNN's debut Electoral College map for 2020". CNN. Retrieved June 16, 2020.
- ^ "Forecasting the US elections". The Economist. Retrieved July 7, 2020.
- ^ "2020 Election Battleground Tracker". CBS News. July 12, 2020. Retrieved July 13, 2020.
- ^ "2020 Presidential Election Interactive Map". 270 to Win.
- ^ "ABC News Race Ratings". CBS News. July 24, 2020. Retrieved July 24, 2020.
- ^ "Final NPR Electoral Map: Biden Has The Edge, But Trump Retains Narrow Path". NPR. Retrieved October 31, 2020.
- ^ "Biden dominates the electoral map, but here's how the race could tighten". NBC News. August 6, 2020. Retrieved August 6, 2020.
- ^ "2020 Election Forecast". FiveThirtyEight. August 12, 2020. Retrieved August 14, 2020.
- ^ "2020 Battleground Power Rankings". Fox News. Retrieved November 2, 2020.
- ^ "Official General Election Results: U.S. President" (PDF). New Jersey Division of Elections. Retrieved December 7, 2020.
- ^ "Daily Kos Elections' presidential results by congressional district for 2020, 2016, and 2012". Daily Kos. Retrieved February 10, 2021.
- ^ "New Jersey Department of State - Division of Elections".
- ^ a b "NJ DOS - Division of Elections - 2020 Election Information".
- ^ "2004 Presidential Election - Essex County" (PDF).
- ^ "Covered Areas for Voting Rights Bilingual Election Materials—2015", Voting Rights Act Amendments of 2006, Determinations Under Section 203, Federal Register, retrieved October 13, 2020,
A Notice by the Census Bureau on 12/05/2016
Further reading edit
- Summary: State Laws on Presidential Electors (PDF), Washington DC: National Association of Secretaries of State, August 2020,
New Jersey
External links edit
- Government Documents Round Table of the American Library Association, "New Jersey", Voting & Elections Toolkits
- "New Jersey: Election Tools, Deadlines, Dates, Rules, and Links", Vote.org, Oakland, CA
- "League of Women Voters of New Jersey". (State affiliate of the U.S. League of Women Voters)
- New Jersey at Ballotpedia