


Summary
The 2020 United States presidential election in Wyoming was held on Tuesday, November 3, 2020, as part of the 2020 United States presidential election in which all 50 states and the District of Columbia participated.[2] Wyoming voters chose electors to represent them in the Electoral College via a popular vote, pitting the Republican Party's nominee, incumbent President Donald Trump and running mate Vice President Mike Pence, against Democratic Party nominee, former Vice President Joe Biden and his running mate California Senator Kamala Harris. Wyoming has three electoral votes in the Electoral College.[3] Trump, the Republican nominee and incumbent president of the United States, won the state's three electoral votes.
| ||||||||||||||||||||||||||
| Turnout | 62.6% | |||||||||||||||||||||||||
|---|---|---|---|---|---|---|---|---|---|---|---|---|---|---|---|---|---|---|---|---|---|---|---|---|---|---|
| ||||||||||||||||||||||||||

| ||||||||||||||||||||||||||
| ||||||||||||||||||||||||||

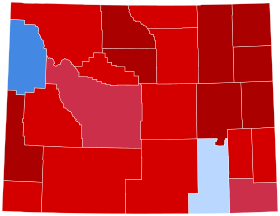
Trump routed Biden in Wyoming, with his 69.94% vote share there making it his strongest win in the election. He won the sparsely populated state by a margin of 43.39%, down from his 46.29% four years earlier. Prior to the election, all news organizations declared Wyoming a safe red state, therefore justifying its status as one of the safest red states in the country, not being won by a Democrat since Lyndon B. Johnson's 1964 landslide victory. Trump's 69.94% of the vote is the second-highest ever by a presidential candidate in Wyoming, only surpassed by Ronald Reagan during his 1984 landslide.
Despite his loss, Biden scored a landslide win in Teton County, garnering a larger vote share in it than any nominee since 1984. He also narrowly flipped the bellwether of Albany County, anchored by the college town of Laramie, which had supported Obama in 2008 before returning to the Republican Party in 2012 and 2016, albeit by a narrow margin.[4] Per exit polls by the Associated Press, Trump's strength in Wyoming came from whites, who comprised 89% of the electorate, and from voters prioritizing energy policy, with 62% believing the government should focus on expanding production of fossil fuels such as oil, gas, or coal.[5]
Caucuses edit
Democratic caucuses edit
The Democratic caucuses were originally scheduled for April 4, 2020. On March 22, due to concerns over the COVID-19 pandemic, the Wyoming Democratic Party canceled in-person voting in favor of mail-in voting. The deadline was also extended to April 17.[6]
| Candidate | Votes | % | Delegates[8] |
|---|---|---|---|
| Joe Biden | 10,912 | 72.2% | 12 |
| Bernie Sanders (suspended) | 4,206 | 27.8% | 2 |
| Total | 15,118 | 100% | 14 |
Republican caucuses edit
The Republican state party convention was held in May to officially select the final delegates to the national convention. Trump won all 29 delegates from Wyoming: 12 at the county conventions and 17 at the state convention.[9]
General election edit
Predictions edit
| Source | Ranking | As of |
|---|---|---|
| The Cook Political Report[10] | Safe R | November 3, 2020 |
| Inside Elections[11] | Safe R | November 3, 2020 |
| Sabato's Crystal Ball[12] | Safe R | November 3, 2020 |
| Politico[13] | Safe R | November 3, 2020 |
| RCP[14] | Safe R | November 3, 2020 |
| Niskanen[15] | Safe R | November 3, 2020 |
| CNN[16] | Safe R | November 3, 2020 |
| The Economist[17] | Safe R | November 3, 2020 |
| CBS News[18] | Likely R | November 3, 2020 |
| 270towin[19] | Safe R | November 3, 2020 |
| ABC News[20] | Safe R | November 3, 2020 |
| NPR[21] | Likely R | November 3, 2020 |
| NBC News[22] | Safe R | November 3, 2020 |
| 538[23] | Safe R | November 3, 2020 |
Polling edit
Graphical summary edit
Aggregate polls edit
| Source of poll aggregation |
Dates updated |
Joe Biden Democratic |
Donald Trump Republican |
Other/ Undecided [a] |
Margin |
|---|---|---|---|---|---|
| FiveThirtyEight | November 3, 2020 | 30.8% | 62.3% | 6.9% | Trump +31.5 |
Polls edit
Polls with a sample size of <100 have their sample size entries marked in red to indicate a lack of reliability.
| Poll source | Date(s) administered |
Sample size[b] |
Margin of error |
Donald Trump Republican |
Joe Biden Democratic |
Jo Jorgensen Libertarian |
Other | Undecided |
|---|---|---|---|---|---|---|---|---|
| SurveyMonkey/Axios | Oct 20 – Nov 2, 2020 | 367 (LV) | ± 7% | 66%[c] | 33% | – | – | – |
| University of Wyoming | Oct 8–28, 2020 | 614 (LV) | ± 4% | 59% | 31% | 5% | – | – |
| SurveyMonkey/Axios | Oct 1–28, 2020 | 739 (LV) | – | 68% | 31% | – | – | – |
| SurveyMonkey/Axios | Sep 1–30, 2020 | 236 (LV) | – | 65% | 34% | – | – | 1% |
| SurveyMonkey/Axios | Aug 1–31, 2020 | 211 (LV) | – | 74% | 25% | – | – | 1% |
| SurveyMonkey/Axios | Jul 1–31, 2020 | 246 (LV) | – | 70% | 28% | – | – | 2% |
| SurveyMonkey/Axios | Jun 8–30, 2020 | 98 (LV) | – | 78% | 22% | – | – | 0% |
Electoral slates edit
These slates of electors were nominated by each party in order to vote in the Electoral College should their candidate win the state:[24]
| Donald Trump and Mike Pence Republican Party |
Joe Biden and Kamala Harris Democratic Party |
Jo Jorgensen and Spike Cohen Libertarian Party |
Don Blankenship and William Mohr Constitution Party |
Brock Pierce and Karla Ballard Independent |
|---|---|---|---|---|
| Marti Halverson Doug Chamberlain Karl Allred |
Kelly Tamblyn Andrea Clifford Milward Simpson |
Shawn Johnson Jared Baldes Richard Brubaker |
Cindy Haggett Michael O'Brien Nanette Hinck |
Luke Onderko Joann Dawn Grisham Elizabeth Batton |
Results edit
| Party | Candidate | Votes | % | ±% | |
|---|---|---|---|---|---|
| Republican | Donald Trump (incumbent) Mike Pence (incumbent) |
193,559 | 69.94% | +2.54% | |
| Democratic | Joe Biden Kamala Harris |
73,491 | 26.55% | +4.92% | |
| Libertarian | Jo Jorgensen Spike Cohen |
5,768 | 2.08% | −3.05% | |
| Independent | Brock Pierce Karla Ballard |
2,208 | 0.80% | N/A | |
| Write-in | 1,739 | 0.63% | −2.04% | ||
| Total votes | 276,765 | 100.00% | |||
| Republican win | |||||
By county edit
| County | Donald Trump Republican |
Joe Biden Democratic |
Various candidates Other parties |
Margin | Total votes cast | ||||
|---|---|---|---|---|---|---|---|---|---|
| # | % | # | % | # | % | # | % | ||
| Albany | 8,579 | 46.08% | 9,092 | 48.84% | 946 | 5.09% | -513 | -2.76% | 18,617 |
| Big Horn | 4,806 | 83.55% | 788 | 13.70% | 158 | 2.75% | 4,018 | 69.85% | 5,752 |
| Campbell | 16,975 | 86.76% | 1,935 | 9.89% | 656 | 3.35% | 15,040 | 76.87% | 19,566 |
| Carbon | 5,014 | 75.24% | 1,427 | 21.41% | 223 | 3.35% | 3,587 | 53.83% | 6,664 |
| Converse | 5,917 | 84.89% | 861 | 12.35% | 192 | 2.76% | 5,056 | 72.54% | 6,970 |
| Crook | 3,651 | 88.64% | 378 | 9.18% | 90 | 2.18% | 3,273 | 79.46% | 4,119 |
| Fremont | 12,007 | 66.30% | 5,519 | 30.47% | 585 | 3.23% | 6,488 | 35.83% | 18,111 |
| Goshen | 4,878 | 78.16% | 1,203 | 19.28% | 160 | 2.57% | 3,675 | 58.88% | 6,241 |
| Hot Springs | 1,999 | 77.57% | 482 | 18.70% | 96 | 3.73% | 1,517 | 58.87% | 2,577 |
| Johnson | 3,881 | 78.98% | 897 | 18.25% | 136 | 2.77% | 2,984 | 60.73% | 4,914 |
| Laramie | 27,891 | 62.00% | 15,217 | 33.83% | 1,874 | 4.16% | 12,674 | 28.17% | 44,982 |
| Lincoln | 8,643 | 82.57% | 1,509 | 14.42% | 316 | 3.03% | 7,134 | 68.15% | 10,468 |
| Natrona | 25,271 | 71.79% | 8,530 | 24.23% | 1,401 | 3.98% | 16,741 | 47.56% | 35,202 |
| Niobrara | 1,118 | 85.47% | 155 | 11.85% | 35 | 2.68% | 963 | 73.62% | 1,308 |
| Park | 12,813 | 76.65% | 3,410 | 20.40% | 494 | 2.96% | 9,403 | 56.25% | 16,717 |
| Platte | 3,898 | 79.18% | 890 | 18.08% | 135 | 2.75% | 3,008 | 61.10% | 4,923 |
| Sheridan | 11,843 | 72.09% | 4,043 | 24.61% | 542 | 3.29% | 7,800 | 47.48% | 16,428 |
| Sublette | 3,957 | 79.62% | 882 | 17.75% | 131 | 2.63% | 3,075 | 61.87% | 4,970 |
| Sweetwater | 12,229 | 73.66% | 3,823 | 23.03% | 551 | 3.32% | 8,406 | 50.63% | 16,603 |
| Teton | 4,341 | 29.58% | 9,848 | 67.10% | 488 | 3.33% | -5,507 | -37.52% | 14,677 |
| Uinta | 7,496 | 79.73% | 1,591 | 16.92% | 315 | 3.35% | 5,905 | 62.81% | 9,402 |
| Washakie | 3,245 | 80.88% | 651 | 16.23% | 116 | 2.89% | 2,594 | 64.65% | 4,012 |
| Weston | 3,107 | 87.72% | 360 | 10.16% | 75 | 2.11% | 2,747 | 77.56% | 3,542 |
| Total | 193,559 | 69.94% | 73,491 | 26.55% | 9,715 | 3.51% | 120,068 | 43.39% | 276,765 |


Counties that flipped from Republican to Democratic edit
By congressional district edit
Due to the state's low population, only one congressional district is allocated. This district is called the At-Large district, because it covers the entire state, and thus is equivalent to the statewide election results.
| District | Trump | Biden | Representative |
|---|---|---|---|
| At-large | 69.94% | 26.55% | Liz Cheney |
See also edit
Notes edit
References edit
- ^ "Wyoming Voter Registration and Voter Turnout Statistics" (PDF). sos.wyo.gov/. Retrieved November 11, 2020.
- ^ Kelly, Ben (August 13, 2018). "US elections key dates: When are the 2018 midterms and the 2020 presidential campaign?". The Independent. Archived from the original on August 2, 2018. Retrieved January 3, 2019.
- ^ "Distribution of Electoral Votes". National Archives and Records Administration. Retrieved January 3, 2019.
- ^ "County winners, 1836-2016". Google Docs. Retrieved November 20, 2020.
- ^ "Wyoming Voter Surveys: How Different Groups Voted". The New York Times. November 3, 2020. ISSN 0362-4331. Retrieved November 17, 2020.
- ^ "Wyoming Democratic Caucus moves to only mail-in voting". Wyoming Tribune Eagle. March 22, 2020.
- ^ "2020 Caucus Results". www.wyodems.org. Wyoming Democratic Party. Archived from the original on September 13, 2020. Retrieved April 19, 2020.
- ^ "Delegate Tracker". interactives.ap.org. Associated Press. Retrieved April 19, 2020.
- ^ "Wyoming Republican Delegation 2020". The Green Papers. Retrieved February 21, 2020.
- ^ "2020 POTUS Race ratings" (PDF). The Cook Political Report. Retrieved May 21, 2019.
- ^ "POTUS Ratings | Inside Elections". insideelections.com. Retrieved May 21, 2019.
- ^ "Larry J. Sabato's Crystal Ball » 2020 President". crystalball.centerforpolitics.org. Retrieved May 21, 2019.
- ^ "2020 Election Forecast". Politico. November 19, 2019.
- ^ "Battle for White House". RCP. April 19, 2019.
- ^ 2020 Bitecofer Model Electoral College Predictions Archived April 23, 2020, at the Wayback Machine, Niskanen Center, March 24, 2020, retrieved: April 19, 2020.
- ^ David Chalian; Terence Burlij (June 11, 2020). "Road to 270: CNN's debut Electoral College map for 2020". CNN. Retrieved June 16, 2020.
- ^ "Forecasting the US elections". The Economist. Retrieved July 7, 2020.
- ^ "2020 Election Battleground Tracker". CBS News. July 12, 2020. Retrieved July 13, 2020.
- ^ "2020 Presidential Election Interactive Map". 270 to Win.
- ^ "ABC News Race Ratings". CBS News. July 24, 2020. Retrieved July 24, 2020.
- ^ Montanaro, Domenico (August 3, 2020). "2020 Electoral Map Ratings: Trump Slides, Biden Advantage Expands Over 270 Votes". NPR.org. Retrieved August 3, 2020.
- ^ "Biden dominates the electoral map, but here's how the race could tighten". NBC News. August 6, 2020. Retrieved August 6, 2020.
- ^ "2020 Election Forecast". FiveThirtyEight. August 12, 2020. Retrieved August 14, 2020.
- ^ "2020 Presidential Electors Information" (PDF). Wyoming Secretary of State. Retrieved December 6, 2020.
- ^ "Statewide Candidates Official Summary Wyoming General Election - November 3, 2020" (PDF). sos.wyo.gov/. Retrieved November 11, 2020.
External links edit
- Government Documents Round Table of the American Library Association, "Wyoming", Voting & Elections Toolkits
- "Wyoming: Election Tools, Deadlines, Dates, Rules, and Links", Vote.org, Oakland, CA
- "League of Women Voters of Wyoming". (State affiliate of the U.S. League of Women Voters)
- Wyoming at Ballotpedia