


Summary
In probability theory and statistics, the Bernoulli distribution, named after Swiss mathematician Jacob Bernoulli,[1] is the discrete probability distribution of a random variable which takes the value 1 with probability and the value 0 with probability . Less formally, it can be thought of as a model for the set of possible outcomes of any single experiment that asks a yes–no question. Such questions lead to outcomes that are Boolean-valued: a single bit whose value is success/yes/true/one with probability p and failure/no/false/zero with probability q. It can be used to represent a (possibly biased) coin toss where 1 and 0 would represent "heads" and "tails", respectively, and p would be the probability of the coin landing on heads (or vice versa where 1 would represent tails and p would be the probability of tails). In particular, unfair coins would have


|
Probability mass function 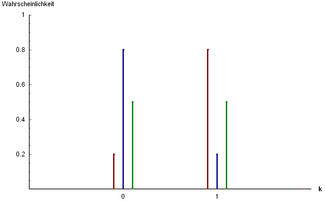
Three examples of Bernoulli distribution: and
and
and | |||
| Parameters |
| ||
|---|---|---|---|
| Support | |||
| PMF | |||
| CDF | |||
| Mean | |||
| Median | |||
| Mode | |||
| Variance | |||
| MAD | |||
| Skewness | |||
| Excess kurtosis | |||
| Entropy | |||
| MGF | |||
| CF | |||
| PGF | |||
| Fisher information | |||


![{\displaystyle {\begin{cases}0&{\text{if }}p<1/2\\\left[0,1\right]&{\text{if }}p=1/2\\1&{\text{if }}p>1/2\end{cases}}}](https://wikimedia.org/api/rest_v1/media/math/render/svg/482cc0f5f8c739e3fe2462d72ee5b9f1f7b5d5a4)


The Bernoulli distribution is a special case of the binomial distribution where a single trial is conducted (so n would be 1 for such a binomial distribution). It is also a special case of the two-point distribution, for which the possible outcomes need not be 0 and 1. [2]
Properties edit
If is a random variable with a Bernoulli distribution, then:


The probability mass function of this distribution, over possible outcomes k, is


This can also be expressed as

or as

The Bernoulli distribution is a special case of the binomial distribution with [4]

The kurtosis goes to infinity for high and low values of but for the two-point distributions including the Bernoulli distribution have a lower excess kurtosis, namely −2, than any other probability distribution.


The Bernoulli distributions for form an exponential family.
The maximum likelihood estimator of based on a random sample is the sample mean.

Mean edit
The expected value of a Bernoulli random variable is
![{\displaystyle \operatorname {E} [X]=p}](https://wikimedia.org/api/rest_v1/media/math/render/svg/0eb41a45634ab84b13b83cb1488b626aa2129285)
This is due to the fact that for a Bernoulli distributed random variable with and we find


![{\displaystyle \operatorname {E} [X]=\Pr(X=1)\cdot 1+\Pr(X=0)\cdot 0=p\cdot 1+q\cdot 0=p.}](https://wikimedia.org/api/rest_v1/media/math/render/svg/5011326253761bfe33bc3d51773a83268b8a56b7)
Variance edit
The variance of a Bernoulli distributed is
![{\displaystyle \operatorname {Var} [X]=pq=p(1-p)}](https://wikimedia.org/api/rest_v1/media/math/render/svg/2d4e26d8a1fdfb90e91a2fafd5fb3841de88f1fb)
We first find
![{\displaystyle \operatorname {E} [X^{2}]=\Pr(X=1)\cdot 1^{2}+\Pr(X=0)\cdot 0^{2}=p\cdot 1^{2}+q\cdot 0^{2}=p=\operatorname {E} [X]}](https://wikimedia.org/api/rest_v1/media/math/render/svg/1bf32718a7a52087297a46d9ebc177ee0c80df07)
From this follows
![{\displaystyle \operatorname {Var} [X]=\operatorname {E} [X^{2}]-\operatorname {E} [X]^{2}=\operatorname {E} [X]-\operatorname {E} [X]^{2}=p-p^{2}=p(1-p)=pq}](https://wikimedia.org/api/rest_v1/media/math/render/svg/41972e4aade1430eb47d46a91051f00a583e0c45)
With this result it is easy to prove that, for any Bernoulli distribution, its variance will have a value inside .
![{\displaystyle [0,1/4]}](https://wikimedia.org/api/rest_v1/media/math/render/svg/604604d2122dc1c25141a841483b889d6832f261)
Skewness edit
The skewness is . When we take the standardized Bernoulli distributed random variable we find that this random variable attains with probability and attains with probability . Thus we get

![{\displaystyle {\frac {X-\operatorname {E} [X]}{\sqrt {\operatorname {Var} [X]}}}}](https://wikimedia.org/api/rest_v1/media/math/render/svg/3bdd3a134128b0517590174937df60485f0828d0)


![{\displaystyle {\begin{aligned}\gamma _{1}&=\operatorname {E} \left[\left({\frac {X-\operatorname {E} [X]}{\sqrt {\operatorname {Var} [X]}}}\right)^{3}\right]\\&=p\cdot \left({\frac {q}{\sqrt {pq}}}\right)^{3}+q\cdot \left(-{\frac {p}{\sqrt {pq}}}\right)^{3}\\&={\frac {1}{{\sqrt {pq}}^{3}}}\left(pq^{3}-qp^{3}\right)\\&={\frac {pq}{{\sqrt {pq}}^{3}}}(q-p)\\&={\frac {q-p}{\sqrt {pq}}}.\end{aligned}}}](https://wikimedia.org/api/rest_v1/media/math/render/svg/2f5c4b867e768adc821f038408b00a6c8bdce2e4)
Higher moments and cumulants edit
The raw moments are all equal due to the fact that and .


![{\displaystyle \operatorname {E} [X^{k}]=\Pr(X=1)\cdot 1^{k}+\Pr(X=0)\cdot 0^{k}=p\cdot 1+q\cdot 0=p=\operatorname {E} [X].}](https://wikimedia.org/api/rest_v1/media/math/render/svg/5cbafd464e73d482dc6c32d1c4f3eaedd5539952)
The central moment of order is given by


The first six central moments are

The higher central moments can be expressed more compactly in terms of and


The first six cumulants are

Related distributions edit
- If are independent, identically distributed (i.i.d.) random variables, all Bernoulli trials with success probability p, then their sum is distributed according to a binomial distribution with parameters n and p:


- The Bernoulli distribution is simply , also written as


- The categorical distribution is the generalization of the Bernoulli distribution for variables with any constant number of discrete values.
- The Beta distribution is the conjugate prior of the Bernoulli distribution.[5]
- The geometric distribution models the number of independent and identical Bernoulli trials needed to get one success.
- If , then has a Rademacher distribution.


See also edit
- Bernoulli process, a random process consisting of a sequence of independent Bernoulli trials
- Bernoulli sampling
- Binary entropy function
- Binary decision diagram
References edit
- ^ Uspensky, James Victor (1937). Introduction to Mathematical Probability. New York: McGraw-Hill. p. 45. OCLC 996937.
- ^ Dekking, Frederik; Kraaikamp, Cornelis; Lopuhaä, Hendrik; Meester, Ludolf (9 October 2010). A Modern Introduction to Probability and Statistics (1 ed.). Springer London. pp. 43–48. ISBN 9781849969529.
- ^ a b c d Bertsekas, Dimitri P. (2002). Introduction to Probability. Tsitsiklis, John N., Τσιτσικλής, Γιάννης Ν. Belmont, Mass.: Athena Scientific. ISBN 188652940X. OCLC 51441829.
- ^ McCullagh, Peter; Nelder, John (1989). Generalized Linear Models, Second Edition. Boca Raton: Chapman and Hall/CRC. Section 4.2.2. ISBN 0-412-31760-5.
- ^ Orloff, Jeremy; Bloom, Jonathan. "Conjugate priors: Beta and normal" (PDF). math.mit.edu. Retrieved October 20, 2023.
Further reading edit
- Johnson, N. L.; Kotz, S.; Kemp, A. (1993). Univariate Discrete Distributions (2nd ed.). Wiley. ISBN 0-471-54897-9.
- Peatman, John G. (1963). Introduction to Applied Statistics. New York: Harper & Row. pp. 162–171.
External links edit
- "Binomial distribution", Encyclopedia of Mathematics, EMS Press, 2001 [1994].
- Weisstein, Eric W. "Bernoulli Distribution". MathWorld.
- Interactive graphic: Univariate Distribution Relationships.