
KNOWPIA
WELCOME TO KNOWPIA

Crazy Peak 
Summary
Crazy Peak, elevation 11,214 ft (3,418 m), is the highest peak in the Crazy Mountains, an island range of the Montana Rockies, in the United States.[3] Crazy Peak dominates the surroundings, rising over 7,000 feet (2,100 m) above the Yellowstone River Valley, and is the highest peak in Montana north of the Beartooth Mountains, which are 50 miles (80 km) to the south. Crazy Peak is also the most topographically prominent peak in Montana.[4] A small glacier exists on the northeast slope of the mountain. The mountain is located on private land within the Gallatin National Forest.
| Crazy Peak | |
|---|---|
 Crazy Peak at left background | |
| Highest point | |
| Elevation | 11,209 ft (3,417 m)[1] |
| Prominence | 5,719 ft (1,743 m)[1] |
| Listing | |
| Coordinates | 46°01′05″N 110°16′36″W / 46.01806°N 110.27667°W[2] |
| Geography | |
 Crazy Peak Location in Montana 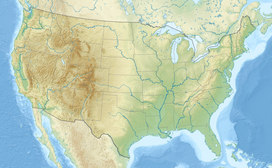 Crazy Peak Location in the United States | |
| Location | Sweet Grass County, Montana, U.S. |
| Parent range | Crazy Mountains |
| Topo map | USGS Crazy Peak |
| Climbing | |
| Easiest route | Hike, scramble |
Climate edit
| Climate data for Crazy Peak 46.0196 N, 110.2753 W, Elevation: 10,600 ft (3,200 m) (1991–2020 normals) | |||||||||||||
|---|---|---|---|---|---|---|---|---|---|---|---|---|---|
| Month | Jan | Feb | Mar | Apr | May | Jun | Jul | Aug | Sep | Oct | Nov | Dec | Year |
| Mean daily maximum °F (°C) | 21.8 (−5.7) |
21.1 (−6.1) |
26.0 (−3.3) |
31.3 (−0.4) |
40.8 (4.9) |
50.8 (10.4) |
62.1 (16.7) |
61.6 (16.4) |
51.9 (11.1) |
38.5 (3.6) |
26.9 (−2.8) |
20.9 (−6.2) |
37.8 (3.2) |
| Daily mean °F (°C) | 13.2 (−10.4) |
11.6 (−11.3) |
15.9 (−8.9) |
20.5 (−6.4) |
29.3 (−1.5) |
38.6 (3.7) |
48.3 (9.1) |
47.9 (8.8) |
39.2 (4.0) |
27.5 (−2.5) |
18.3 (−7.6) |
12.6 (−10.8) |
26.9 (−2.8) |
| Mean daily minimum °F (°C) | 4.6 (−15.2) |
2.1 (−16.6) |
5.8 (−14.6) |
9.6 (−12.4) |
17.9 (−7.8) |
26.4 (−3.1) |
34.5 (1.4) |
34.2 (1.2) |
26.4 (−3.1) |
16.6 (−8.6) |
9.7 (−12.4) |
4.3 (−15.4) |
16.0 (−8.9) |
| Average precipitation inches (mm) | 4.41 (112) |
4.06 (103) |
4.94 (125) |
6.75 (171) |
5.66 (144) |
5.41 (137) |
2.52 (64) |
2.02 (51) |
2.79 (71) |
4.42 (112) |
4.39 (112) |
4.21 (107) |
51.58 (1,309) |
| Source: PRISM Climate Group[5] | |||||||||||||
See also edit
References edit
- ^ a b "Crazy Peak, Montana". Peakbagger.com. Retrieved September 15, 2014.
- ^ "Crazy Peak". Geographic Names Information System. United States Geological Survey, United States Department of the Interior. Retrieved September 15, 2014.
- ^ Crazy Peak, MT (Map). TopoQwest (United States Geological Survey Maps). Retrieved September 15, 2014.
- ^ "America's 57 - the Ultras". Peaklist. Retrieved September 15, 2014.
- ^ "PRISM Climate Group, Oregon State University". PRISM Climate Group, Oregon State University. Retrieved October 2, 2023.
To find the table data on the PRISM website, start by clicking Coordinates (under Location); copy Latitude and Longitude figures from top of table; click Zoom to location; click Precipitation, Minimum temp, Mean temp, Maximum temp; click 30-year normals, 1991-2020; click 800m; click Retrieve Time Series button.
External links edit
Crazy Peak at Wikipedia's sister projects
 Definitions from Wiktionary
 Media from Commons
 News from Wikinews
 Quotations from Wikiquote
 Texts from Wikisource
 Textbooks from Wikibooks
 Resources from Wikiversity