


Summary
Fluorescence spectroscopy (also known as fluorimetry or spectrofluorometry) is a type of electromagnetic spectroscopy that analyzes fluorescence from a sample. It involves using a beam of light, usually ultraviolet light, that excites the electrons in molecules of certain compounds and causes them to emit light; typically, but not necessarily, visible light. A complementary technique is absorption spectroscopy. In the special case of single molecule fluorescence spectroscopy, intensity fluctuations from the emitted light are measured from either single fluorophores, or pairs of fluorophores.
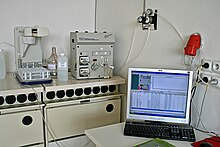
Devices that measure fluorescence are called fluorometers.
Theory
editMolecules have various states referred to as energy levels. Fluorescence spectroscopy is primarily concerned with electronic and vibrational states. Generally, the species being examined has a ground electronic state (a low energy state) of interest, and an excited electronic state of higher energy. Within each of these electronic states there are various vibrational states.[1]
In fluorescence, the species is first excited, by absorbing a photon, from its ground electronic state to one of the various vibrational states in the excited electronic state. Collisions with other molecules cause the excited molecule to lose vibrational energy until it reaches the lowest vibrational state from the excited electronic state. This process is often visualized with a Jablonski diagram.[1]
The molecule then drops down to one of the various vibrational levels of the ground electronic state again, emitting a photon in the process.[1] As molecules may drop down into any of several vibrational levels in the ground state, the emitted photons will have different energies, and thus frequencies. Therefore, by analysing the different frequencies of light emitted in fluorescent spectroscopy, along with their relative intensities, the structure of the different vibrational levels can be determined.
For atomic species, the process is similar; however, since atomic species do not have vibrational energy levels, the emitted photons are often at the same wavelength as the incident radiation. This process of re-emitting the absorbed photon is "resonance fluorescence" and while it is characteristic of atomic fluorescence, is seen in molecular fluorescence as well.[2]
In a typical fluorescence (emission) measurement, the excitation wavelength is fixed and the detection wavelength varies, while in a fluorescence excitation measurement the detection wavelength is fixed and the excitation wavelength is varied across a region of interest. An emission map is measured by recording the emission spectra resulting from a range of excitation wavelengths and combining them all together. This is a three dimensional surface data set: emission intensity as a function of excitation and emission wavelengths, and is typically depicted as a contour map.
Instrumentation
editTwo general types of instruments exist: filter fluorometers that use filters to isolate the incident light and fluorescent light and spectrofluorometers that use diffraction grating monochromators to isolate the incident light and fluorescent light.
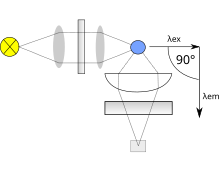
Both types use the following scheme: the light from an excitation source passes through a filter or monochromator, and strikes the sample. A proportion of the incident light is absorbed by the sample, and some of the molecules in the sample fluoresce. The fluorescent light is emitted in all directions. Some of this fluorescent light passes through a second filter or monochromator and reaches a detector, which is usually placed at 90° to the incident light beam to minimize the risk of transmitted or reflected incident light reaching the detector.
Various light sources may be used as excitation sources, including lasers, LED, and lamps; xenon arcs and mercury-vapor lamps in particular. A laser only emits light of high irradiance at a very narrow wavelength interval, typically under 0.01 nm, which makes an excitation monochromator or filter unnecessary. The disadvantage of this method is that the wavelength of a laser cannot be changed by much. A mercury vapor lamp is a line lamp, meaning it emits light near peak wavelengths. By contrast, a xenon arc has a continuous emission spectrum with nearly constant intensity in the range from 300-800 nm and a sufficient irradiance for measurements down to just above 200 nm.
Filters and/or monochromators may be used in fluorimeters. A monochromator transmits light of an adjustable wavelength with an adjustable tolerance. The most common type of monochromator utilizes a diffraction grating, that is, collimated light illuminates a grating and exits with a different angle depending on the wavelength. The monochromator can then be adjusted to select which wavelengths to transmit. For allowing anisotropy measurements, the addition of two polarization filters is necessary: One after the excitation monochromator or filter, and one before the emission monochromator or filter.
As mentioned before, the fluorescence is most often measured at a 90° angle relative to the excitation light. This geometry is used instead of placing the sensor at the line of the excitation light at a 180° angle in order to avoid interference of the transmitted excitation light. No monochromator is perfect and it will transmit some stray light, that is, light with other wavelengths than the targeted. An ideal monochromator would only transmit light in the specified range and have a high wavelength-independent transmission. When measuring at a 90° angle, only the light scattered by the sample causes stray light. This results in a better signal-to-noise ratio, and lowers the detection limit by approximately a factor 10000,[3] when compared to the 180° geometry. Furthermore, the fluorescence can also be measured from the front, which is often done for turbid or opaque samples .[4]
The detector can either be single-channeled or multichanneled. The single-channeled detector can only detect the intensity of one wavelength at a time, while the multichanneled one detects the intensity of all wavelengths simultaneously, making the emission monochromator or filter unnecessary.
The most versatile fluorimeters with dual monochromators and a continuous excitation light source can record both an excitation spectrum and a fluorescence spectrum. When measuring fluorescence spectra, the wavelength of the excitation light is kept constant, preferably at a wavelength of high absorption, and the emission monochromator scans the spectrum. For measuring excitation spectra, the wavelength passing through the emission filter or monochromator is kept constant and the excitation monochromator is scanning. The excitation spectrum generally is identical to the absorption spectrum as the fluorescence intensity is proportional to the absorption.[5]
Analysis of data
edit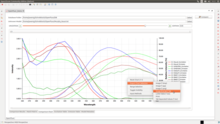

At low concentrations the fluorescence intensity will generally be proportional to the concentration of the fluorophore.
Unlike in UV/visible spectroscopy, ‘standard’, device independent spectra are not easily attained. Several factors influence and distort the spectra, and corrections are necessary to attain ‘true’, i.e. machine-independent, spectra. The different types of distortions will here be classified as being either instrument- or sample-related. Firstly, the distortion arising from the instrument is discussed. As a start, the light source intensity and wavelength characteristics varies over time during each experiment and between each experiment. Furthermore, no lamp has a constant intensity at all wavelengths. To correct this, a beam splitter can be applied after the excitation monochromator or filter to direct a portion of the light to a reference detector.
Additionally, the transmission efficiency of monochromators and filters must be taken into account. These may also change over time. The transmission efficiency of the monochromator also varies depending on wavelength. This is the reason that an optional reference detector should be placed after the excitation monochromator or filter. The percentage of the fluorescence picked up by the detector is also dependent upon the system. Furthermore, the detector quantum efficiency, that is, the percentage of photons detected, varies between different detectors, with wavelength and with time, as the detector inevitably deteriorates.
Two other topics that must be considered include the optics used to direct the radiation and the means of holding or containing the sample material (called a cuvette or cell). For most UV, visible, and NIR measurements the use of precision quartz cuvettes is necessary. In both cases, it is important to select materials that have relatively little absorption in the wavelength range of interest. Quartz is ideal because it transmits from 200 nm-2500 nm; higher grade quartz can even transmit up to 3500 nm, whereas the absorption properties of other materials can mask the fluorescence from the sample.
Correction of all these instrumental factors for getting a ‘standard’ spectrum is a tedious process, which is only applied in practice when it is strictly necessary. This is the case when measuring the quantum yield or when finding the wavelength with the highest emission intensity for instance.
As mentioned earlier, distortions arise from the sample as well. Therefore, some aspects of the sample must be taken into account too. Firstly, photodecomposition may decrease the intensity of fluorescence over time. Scattering of light must also be taken into account. The most significant types of scattering in this context are Rayleigh and Raman scattering. Light scattered by Rayleigh scattering has the same wavelength as the incident light, whereas in Raman scattering the scattered light changes wavelength usually to longer wavelengths. Raman scattering is the result of a virtual electronic state induced by the excitation light. From this virtual state, the molecules may relax back to a vibrational level other than the vibrational ground state.[7] In fluorescence spectra, it is always seen at a constant wavenumber difference relative to the excitation wavenumber e.g. the peak appears at a wavenumber 3600 cm−1 lower than the excitation light in water.
Other aspects to consider are the inner filter effects.[8][9] These include reabsorption. Reabsorption happens because another molecule or part of a macromolecule absorbs at the wavelengths at which the fluorophore emits radiation. If this is the case, some or all of the photons emitted by the fluorophore may be absorbed again. Another inner filter effect occurs because of high concentrations of absorbing molecules, including the fluorophore. The result is that the intensity of the excitation light is not constant throughout the solution. Resultingly, only a small percentage of the excitation light reaches the fluorophores that are visible for the detection system. The inner filter effects change the spectrum and intensity of the emitted light and they must therefore be considered when analysing the emission spectrum of fluorescent light.[5][10]
Tryptophan fluorescence
editThe fluorescence of a folded protein is a mixture of the fluorescence from individual aromatic residues. Most of the intrinsic fluorescence emissions of a folded protein are due to excitation of tryptophan residues, with some emissions due to tyrosine and phenylalanine; but disulfide bonds also have appreciable absorption in this wavelength range. Typically, tryptophan has a wavelength of maximum absorption of 280 nm and an emission peak that is solvatochromic, ranging from ca. 300 to 350 nm depending in the polarity of the local environment [11] Hence, protein fluorescence may be used as a diagnostic of the conformational state of a protein.[12] Furthermore, tryptophan fluorescence is strongly influenced by the proximity of other residues (i.e., nearby protonated groups such as Asp or Glu can cause quenching of Trp fluorescence). Also, energy transfer between tryptophan and the other fluorescent amino acids is possible, which would affect the analysis, especially in cases where the Förster acidic approach is taken. In addition, tryptophan is a relatively rare amino acid; many proteins contain only one or a few tryptophan residues. Therefore, tryptophan fluorescence can be a very sensitive measurement of the conformational state of individual tryptophan residues. The advantage compared to extrinsic probes is that the protein itself is not changed. The use of intrinsic fluorescence for the study of protein conformation is in practice limited to cases with few (or perhaps only one) tryptophan residues, since each experiences a different local environment, which gives rise to different emission spectra.
Tryptophan is an important intrinsic fluorescent (amino acid), which can be used to estimate the nature of microenvironment of the tryptophan. When performing experiments with denaturants, surfactants or other amphiphilic molecules, the microenvironment of the tryptophan might change. For example, if a protein containing a single tryptophan in its 'hydrophobic' core is denatured with increasing temperature, a red-shifted emission spectrum will appear. This is due to the exposure of the tryptophan to an aqueous environment as opposed to a hydrophobic protein interior. In contrast, the addition of a surfactant to a protein which contains a tryptophan which is exposed to the aqueous solvent will cause a blue-shifted emission spectrum if the tryptophan is embedded in the surfactant vesicle or micelle.[13] Proteins that lack tryptophan may be coupled to a fluorophore.
With fluorescence excitation at 295 nm, the tryptophan emission spectrum is dominant over the weaker tyrosine and phenylalanine fluorescence.
Applications
editFluorescence spectroscopy is used in, among others, biochemical, medical, and chemical research fields for analyzing organic compounds. There has also been a report of its use in differentiating malignant skin tumors from benign.
Atomic Fluorescence Spectroscopy (AFS) techniques are useful in other kinds of analysis/measurement of a compound present in air or water, or other media, such as CVAFS which is used for heavy metals detection, such as mercury.
Fluorescence can also be used to redirect photons, see fluorescent solar collector.
Additionally, Fluorescence spectroscopy can be adapted to the microscopic level using microfluorimetry
In analytical chemistry, fluorescence detectors are used with HPLC.
In the field of water research, fluorescence spectroscopy can be used to monitor water quality by detecting organic pollutants.[14] Recent advances in computer science and machine learning have even enabled detection of bacterial contamination of water. [15]
In biomedical research, fluorescence spectroscopy is used to evaluate the efficiency of drug distribution through the cross-linking of fluorescent agents to various drugs. [16]
Fluorescence spectroscopy in biophysical research enables individuals to visualize and characterize lipid domains within cellular membranes. [17]
See also
editReferences
edit- ^ a b c Animation for the principle of fluorescence and UV-visible absorbance
- ^ Principles Of Instrumental Analysis F.James Holler, Douglas A. Skoog & Stanley R. Crouch 2006
- ^ Rendell, D. (1987). Fluorescence and Phosphorescence. Crown
- ^ Eisinger, Josef; Flores, Jorge (1979). "Front-face fluorometry of liquid samples". Analytical Biochemistry. 94 (1): 15–21. doi:10.1016/0003-2697(79)90783-8. ISSN 0003-2697. PMID 464277.
- ^ a b Ashutosh Sharma; Stephen G. Schulman (21 May 1999). Introduction to Fluorescence Spectroscopy. Wiley. ISBN 978-0-471-11098-9.
- ^ Murphy, Kathleen R.; Stedmon, Colin A.; Wenig, Philip; Bro, Rasmus (2014). "OpenFluor– an online spectral library of auto-fluorescence by organic compounds in the environment" (PDF). Anal. Methods. 6 (3): 658–661. doi:10.1039/C3AY41935E.
- ^ Gauglitz, G. and Vo-Dinh, T. (2003). Handbook of spectroscopy. Wiley-VCH.
- ^ Kimball, Joseph; Chavez, Jose; Ceresa, Luca; Kitchner, Emma; Nurekeyev, Zhangatay; Doan, Hung; Szabelski, Mariusz; Borejdo, Julian; Gryczynski, Ignacy; Gryczynski, Zygmunt (2020-06-01). "On the origin and correction for inner filter effects in fluorescence Part I: primary inner filter effect-the proper approach for sample absorbance correction". Methods and Applications in Fluorescence. 8 (3): 033002. Bibcode:2020MApFl...8c3002K. doi:10.1088/2050-6120/ab947c. ISSN 2050-6120. PMID 32428893. S2CID 218758981.
- ^ Ceresa, Luca; Kimball, Joseph; Chavez, Jose; Kitchner, Emma; Nurekeyev, Zhangatay; Doan, Hung; Borejdo, Julian; Gryczynski, Ignacy; Gryczynski, Zygmunt (2021-05-24). "On the origin and correction for inner filter effects in fluorescence. Part II: secondary inner filter effect -the proper use of front-face configuration for highly absorbing and scattering samples". Methods and Applications in Fluorescence. 9 (3): 035005. Bibcode:2021MApFl...9c5005C. doi:10.1088/2050-6120/ac0243. ISSN 2050-6120. PMID 34032610. S2CID 235201243.
- ^ Lakowicz, J. R. (1999). Principles of Fluorescence Spectroscopy. Kluwer Academic / Plenum Publishers
- ^ Intrinsic Fluorescence of Proteins and Peptides Archived 2010-05-16 at the Wayback Machine
- ^ Vivian JT, Callis PR (2001). "Mechanisms of tryptophan fluorescence shifts in proteins". Biophys. J. 80 (5): 2093–109. Bibcode:2001BpJ....80.2093V. doi:10.1016/S0006-3495(01)76183-8. PMC 1301402. PMID 11325713. Archived from the original on September 6, 2008.
- ^ Caputo GA, London E. Cumulative effects of amino acid substitutions and hydrophobic mismatch upon the transmembrane stability and conformation of hydrophobic alpha-helices. Biochemistry. 2003 Mar 25;42(11):3275-85.
- ^ Carstea, Elfrida M.; Bridgeman, John; Baker, Andy; Reynolds, Darren M. (2016-05-15). "Fluorescence spectroscopy for wastewater monitoring: A review" (PDF). Water Research. 95: 205–219. Bibcode:2016WatRe..95..205C. doi:10.1016/j.watres.2016.03.021. ISSN 0043-1354. PMID 26999254. S2CID 205696150.
- ^ Nakar, Amir; Schmilovitch, Ze’ev; Vaizel-Ohayon, Dalit; Kroupitski, Yulia; Borisover, Mikhail; Sela (Saldinger), Shlomo (2020-02-01). "Quantification of bacteria in water using PLS analysis of emission spectra of fluorescence and excitation-emission matrices". Water Research. 169: 115197. Bibcode:2020WatRe.16915197N. doi:10.1016/j.watres.2019.115197. ISSN 0043-1354. PMID 31670087. S2CID 204967767.
- ^ Staley, Ben; Zindy, Egor; Pluen, Alain (2010-12-25). "Quantifying uptake and distribution of arginine rich peptides at therapeutic concentrations using fluorescence correlation spectroscopy and image correlation spectroscopy techniques". Drug Discovery Today. 15 (23–24): 1099–1099. doi:10.1016/j.drudis.2010.09.402.
- ^ Hof, M.; Hutterer, R.; Fidler, V., eds. (2005). Fluorescence Spectroscopy in Biology: Advanced Methods and their Applications to Membranes, Proteins, DNA, and Cells. Springer Series on Fluorescence. Vol. 3. Berlin, Heidelberg: Springer Berlin Heidelberg. doi:10.1007/b138383. ISBN 978-3-540-22338-2.
External links
edit- Fluorophores.org, the database of fluorescent dyes
- OpenFluor, Community tools supporting chemometric analysis of organic matter fluorescence
- Database of fluorescent minerals with pictures, activators and spectra (fluomin.org)