


Summary
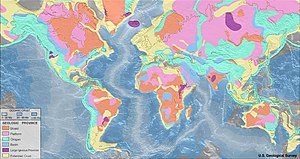
A geologic map or geological map is a special-purpose map made to show various geological features. Rock units or geologic strata are shown by color or symbols. Bedding planes and structural features such as faults, folds, are shown with strike and dip or trend and plunge symbols which give three-dimensional orientations features.
Stratigraphic contour lines may be used to illustrate the surface of a selected stratum illustrating the subsurface topographic trends of the strata. Isopach maps detail the variations in thickness of stratigraphic units. It is not always possible to properly show this when the strata are extremely fractured, mixed, in some discontinuities, or where they are otherwise disturbed.
Symbols edit
Lithologies edit
Rock units are typically represented by colors. Instead of (or in addition to) colors, certain symbols can be used. Different geologic mapping agencies and authorities have different standards for the colors and symbols to be used for rocks of differing types and ages.
Orientations edit
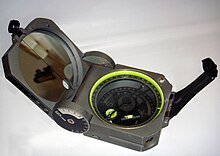
Geologists take two major types of orientation measurements (using a hand compass like a Brunton compass): orientations of planes and orientations of lines. Orientations of planes are measured as a "strike" and "dip", while orientations of lines are measured as a "trend" and "plunge".
Strike and dip symbols consist of a long "strike" line, which is perpendicular to the direction of greatest slope along the surface of the bed, and a shorter "dip" line on side of the strike line where the bed is going downwards. The angle that the bed makes with the horizontal, along the dip direction, is written next to the dip line. In the azimuthal system, strike and dip are often given as "strike/dip" (for example: 270/15, for a strike of west and a dip of 15 degrees below the horizontal).
Trend and plunge are used for linear features, and their symbol is a single arrow on the map. The arrow is oriented in the downgoing direction of the linear feature (the "trend") and at the end of the arrow, the number of degrees that the feature lies below the horizontal (the "plunge") is noted. Trend and plunge are often notated as PLUNGE → TREND (for example: 34 → 86 indicates a feature that is angled at 34 degrees below the horizontal at an angle that is just east of true south).
History edit
The oldest preserved geologic map is the Turin papyrus (1150 BCE), which shows the location of building stone and gold deposits in Egypt.[1][2]
The earliest geologic map of the modern era is the 1771 "Map of Part of Auvergne, or figures of, The Current of Lava in which Prisms, Balls, Etc. are Made from Basalt. To be used with Mr. Demarest's theories of this hard basalt. Engraved by Messr. Pasumot and Daily, Geological Engineers of the King." This map is based on Nicolas Desmarest's 1768 detailed study of the geology and eruptive history of the Auvergne volcanoes and a comparison with the columns of the Giant's Causeway of Ireland. He identified both landmarks as features of extinct volcanoes. The 1768 report was incorporated in the 1771 (French) Royal Academy of Science compendium.
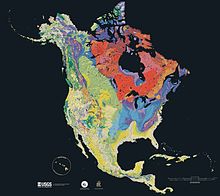
The first geological map of the U.S. was produced in 1809 by William Maclure.[3] In 1807, Maclure undertook the self-imposed task of making a geological survey of the United States. He traversed and mapped nearly every state in the Union. During the rigorous two-year period of his survey, he crossed and recrossed the Allegheny Mountains some 50 times.[4][5] Maclure's map shows the distribution of five classes of rock in what are now only the eastern states of the present-day US.
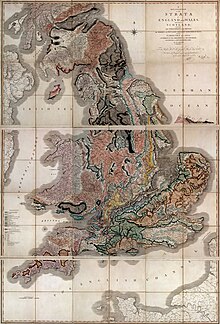
The first geologic map of Great Britain was created by William Smith in 1815 using principles (Smith's laws) first formulated by Smith.[6]
Maps and mapping around the globe edit
Singapore edit
The first geological map of Singapore was produced in 1974, produced by the then Public Work Department. The publication includes a locality map, 8 map sheets detailing the topography and geological units, and a sheet containing cross sections of the island.
Since 1974, for 30 years, there were many findings reported in various technical conferences on newfound geology islandwide, but no new publication was produced. In 2006, Defence Science & Technology Agency, with their developments in underground space promptly started a re-publication of the Geology of Singapore, second edition. The new edition that was published in 2009, contains a 1:75,000 geology map of the island, 6 maps (1:25,000) containing topography, street directory and geology, a sheet of cross section and a locality map.
The difference found between the 1976 Geology of Singapore report include numerous formations found in literature between 1976 and 2009. These include the Fort Canning Boulder Beds and stretches of limestone.
United Kingdom edit
In the United Kingdom, the term geological map is used. The UK and Isle of Man have been extensively mapped by the British Geological Survey (BGS) since 1835; a separate Geological Survey of Northern Ireland (drawing on BGS staff) has operated since 1947.
Two 1:625,000 scale maps cover the basic geology for the UK. More detailed sheets are available at scales of 1:250,000, 1:50,000 and 1:10,000. The 1:625,000 and 1:250,000 scales show both onshore and offshore geology (the 1:250,000 series covers the entire UK continental shelf), whilst other scales generally cover exposures on land only.
Sheets of all scales (though not for all areas) fall into two categories:
- Superficial deposit maps (previously known as solid and drift maps) show both bedrock and the deposits on top of it.
- Bedrock maps (previously known as solid maps) show the underlying rock, without superficial deposits.
The maps are superimposed over a topographic map base produced by Ordnance Survey (OS), and use symbols to represent fault lines, strike and dip or geological units, boreholes etc. Colors are used to represent different geological units. Explanatory booklets (memoirs) are produced for many sheets at the 1:50,000 scale.
Small scale thematic maps (1:1,000,000 to 1:100,000) are also produced covering geochemistry, gravity anomaly, magnetic anomaly, groundwater, etc.
Although BGS maps show the British national grid reference system and employ an OS base map, sheet boundaries are not based on the grid. The 1:50,000 sheets originate from earlier 'one inch to the mile' (1:63,360) coverage utilising the pre-grid Ordnance Survey One Inch Third Edition as the base map. Current sheets are a mixture of modern field mapping at 1:10,000 redrawn at the 1:50,000 scale and older 1:63,360 maps reproduced on a modern base map at 1:50,000. In both cases the original OS Third Edition sheet margins and numbers are retained. The 1:250,000 sheets are defined using lines of latitude and longitude, each extending 1° north-south and 2° east-west.
United States edit

In the United States, geologic maps are usually superimposed over a topographic map (and at times over other base maps) with the addition of a color mask with letter symbols to represent the kind of geologic unit. The color mask denotes the exposure of the immediate bedrock, even if obscured by soil or other cover. Each area of color denotes a geologic unit or particular rock formation (as more information is gathered new geologic units may be defined). However, in areas where the bedrock is overlain by a significantly thick unconsolidated burden of till, terrace sediments, loess deposits, or other important feature, these are shown instead. Stratigraphic contour lines, fault lines, strike and dip symbols, are represented with various symbols as indicated by the map key. Whereas topographic maps are produced by the United States Geological Survey in conjunction with the states, geologic maps are usually produced by the individual states. There are almost no geologic map resources for some states, while a few states, such as Kentucky and Georgia, are extensively mapped geologically.
See also edit
References edit
- ^ Harrell, James A.; Brown, V. Max (1992). "The world's oldest surviving geological map—the 1150 BC Turin papyrus from Egypt". The Journal of Geology. 100 (1): 3–18. Bibcode:1992JG....100....3H. doi:10.1086/629568. JSTOR 30082315. S2CID 140154575.
- ^ Klemm, Rosemarie; Klemm, Dietrich (2013). Gold and Gold Mining in Ancient Egypt and Nubia. Heidelberg: Springer. pp. 132–136. ISBN 9783642225079.
- ^ "Maclure's geological map of the United States". US Library of Congress' Map Collection. Library of Congress. Retrieved 30 October 2015.
- ^ Chisholm, Hugh, ed. (1911). . Encyclopædia Britannica. Vol. 17 (11th ed.). Cambridge University Press. p. 263.
- ^ Greene, J.C.; Burke, J.G. (1978). "The Science of Minerals in the Age of Jefferson". Transactions of the American Philosophical Society. New. 68 (4): 39. doi:10.2307/1006294. JSTOR 1006294. (article pages: 1–113)
- ^ Simon Winchester, 2002, The Map that Changed the World, Harper-Collins ISBN 0-06-093180-9
External links edit
- IGME 5000 International Geological Map of Europe and Adjacent Areas Archived 2017-03-09 at the Wayback Machine 1:5,000,000, Asch, K (2005), Bundesanstalt für Geowissenschaften und Rohstoffe (BGR), Hannover
- Tectonic Map of the World (TeMaW; GIS project) — 1:35,000,000, Russian Geological Research Institute (VSEGEI), The UNESCO Commission for the Geological Map of the World (CGMW) (in progress)
- Geology of Britain viewer from the British Geological Survey, at 1:50,000 and 1:625,000 scales
- Geologic Maps from the National Park Service
- USGS National Geologic Map Database
- Maclure's 1809 Geological Map of the United States
- Geological Field Mapping Techniques