


Summary
The Hayashi track is a luminosity–temperature relationship obeyed by infant stars of less than 3 M☉ in the pre-main-sequence phase (PMS phase) of stellar evolution. It is named after Japanese astrophysicist Chushiro Hayashi. On the Hertzsprung–Russell diagram, which plots luminosity against temperature, the track is a nearly vertical curve. After a protostar ends its phase of rapid contraction and becomes a T Tauri star, it is extremely luminous. The star continues to contract, but much more slowly. While slowly contracting, the star follows the Hayashi track downwards, becoming several times less luminous but staying at roughly the same surface temperature, until either a radiative zone develops, at which point the star starts following the Henyey track, or nuclear fusion begins, marking its entry onto the main sequence.

Low-mass stars have nearly vertical evolution tracks until they arrive on the main sequence. For more-massive stars, the Hayashi track bends to the left into the Henyey track. Even more-massive stars are born directly onto the Henyey track.
The end (leftmost point) of every track is labeled with the star's mass in solar masses (M☉), and represents its position on the main sequence. The red curves labeled in years are isochrones at the given ages. In other words, stars 105 years old lie along the curve labeled 105, and similarly for the other 3 isochrones.
The shape and position of the Hayashi track on the Hertzsprung–Russell diagram depends on the star's mass and chemical composition. For solar-mass stars, the track lies at a temperature of roughly 4000 K. Stars on the track are nearly fully convective and have their opacity dominated by hydrogen ions. Stars less than 0.5 M☉ are fully convective even on the main sequence, but their opacity begins to be dominated by Kramers' opacity law after nuclear fusion begins, thus moving them off the Hayashi track. Stars between 0.5 and 3 M☉ develop a radiative zone prior to reaching the main sequence. Stars between 3 and 10 M☉ are fully radiative at the beginning of the pre-main-sequence. Even heavier stars are born onto the main sequence, with no PMS evolution.[1]
At the end of a low- or intermediate-mass star's life, the star follows an analogue of the Hayashi track, but in reverse—it increases in luminosity, expands, and stays at roughly the same temperature, eventually becoming a red giant.
History edit
In 1961, Professor Chushiro Hayashi published two papers[2][3] that led to the concept of the pre-main-sequence and form the basis of the modern understanding of early stellar evolution. Hayashi realized that the existing model, in which stars are assumed to be in radiative equilibrium with no substantial convection zone, cannot explain the shape of the red-giant branch.[4] He therefore replaced the model by including the effects of thick convection zones on a star's interior.
A few years prior, Osterbrock proposed deep convection zones with efficient convection, analyzing them using the opacity of H- ions (the dominant opacity source in cool atmospheres) in temperatures below 5000K. However, the earliest numerical models of Sun-like stars did not follow up on this work and continued to assume radiative equilibrium.[1]
In his 1961 papers, Hayashi showed that the convective envelope of a star is determined by:


In 1962, Hayashi published a 183-page review of stellar evolution. Here, he discussed the evolution of stars born in the forbidden region. These stars rapidly contract due to gravity before settling to a quasistatic, fully convective state on the Hayashi tracks.
In 1965, numerical models by Iben and Ezer & Cameron realistically simulated pre-main-sequence evolution, including the Henyey track that stars follow after leaving the Hayashi track. These standard PMS tracks can still be found in textbooks on stellar evolution.
Forbidden zone edit
The forbidden zone is the region on the HR diagram to the right of the Hayashi track where no star can be in hydrostatic equilibrium, even those that are partially or fully radiative. Newborn protostars start out in this zone, but are not in hydrostatic equilibrium and will rapidly move towards the Hayashi track.
Because stars emit light via black-body radiation, the power per unit surface area they emit is given by the Stefan–Boltzmann law:


For a given L, a lower temperature implies a larger radius, and vice versa. Thus, the Hayashi track separates the HR diagram into two regions: the allowed region to the left, with high temperatures and smaller radii for each luminosity, and the forbidden region to the right, with lower temperatures and correspondingly higher radii. The Hayashi limit can refer to either the lower bound in temperature or the upper bound on radius defined by the Hayashi track.
The region to the right is forbidden because it can be shown that a star in the region must have a temperature gradient of:


Consider a star with a superadiabatic gradient. Imagine a parcel of gas that starts at radial position r, but moves upwards to r + dr in a sufficiently short time that it exchanges negligible heat with its surroundings—in other words, the process is adiabatic. The pressure of the surroundings, as well as that of the parcel, decreases by some amount dP. The parcel's temperature changes by . The temperature of the surroundings also decreases, but by some amount dT′ that is greater than dT. The parcel therefore ends up being hotter than its surroundings. Since the ideal gas law can be written , a higher temperature implies a lower density at the same pressure. The parcel is therefore also less dense than its surroundings. This will cause it to rise even more, and the parcel will become even less dense than its new surroundings.


Clearly, this situation is not stable. In fact, a superadiabatic gradient causes convection. Convection tends to lower the temperature gradient because the rising parcel of gas will eventually be dispersed, dumping its excess thermal and kinetic energy into its surroundings and heating up said surroundings. In stars, the convection process is known to be highly efficient, with a typical that only exceeds the adiabatic gradient by 1 part in 10 million.[5]

If a star is placed in the forbidden zone, with a temperature gradient much greater than 0.4, it will experience rapid convection that brings the gradient down. Since this convection will drastically change the star's pressure and temperature distribution, the star is not in hydrostatic equilibrium, and will contract until it is.
A star far to the left of the Hayashi track has a temperature gradient smaller than adiabatic. This means that if a parcel of gas rises a tiny bit, it will be more dense than its surroundings and sink back to where it came from. Convection therefore does not occur, and almost all energy output is carried radiatively.
Star formation edit
Stars form when small regions of a giant molecular cloud collapse under their own gravity, becoming protostars. The collapse releases gravitational energy, which heats up the protostar. This process occurs on the free fall timescale , which is roughly 100,000 years for solar-mass protostars, and ends when the protostar reaches approximately 4000 K. This is known as the Hayashi boundary, and at this point, the protostar is on the Hayashi track. At this point, they are known as T Tauri stars and continue to contract, but much more slowly. As they contract, they decrease in luminosity because less surface area becomes available for emitting light. The Hayashi track gives the resulting change in temperature, which will be minimal compared to the change in luminosity because the Hayashi track is nearly vertical. In other words, on the HR diagram, a T Tauri star starts out on the Hayashi track with a high luminosity and moves downward along the track as time passes.
The Hayashi track describes a fully convective star. This is a good approximation for very young pre-main-sequence stars they are still cool and highly opaque, so that radiative transport is insufficient to carry away the generated energy and convection must occur. Stars less massive than 0.5 M☉ remain fully convective, and therefore remain on the Hayashi track, throughout their pre-main-sequence stage, joining the main sequence at the bottom of the Hayashi track. Stars heavier than 0.5 M☉ have higher interior temperatures, which decreases their central opacity and allows radiation to carry away large amounts of energy. This allows a radiative zone to develop around the star's core. The star is then no longer on the Hayashi track, and experiences a period of rapidly increasing temperature at nearly constant luminosity. This is called the Henyey track, and ends when temperatures are high enough to ignite hydrogen fusion in the core. The star is then on the main sequence.
Lower-mass stars follow the Hayashi track until the track intersects with the main sequence, at which point hydrogen fusion begins and the star follows the main sequence. Even lower-mass 'stars' never achieve the conditions necessary to fuse hydrogen and become brown dwarfs.
Derivation edit
The exact shape and position of the Hayashi track can only be computed numerically using computer models. Nevertheless, we can make an extremely crude analytical argument that captures most of the track's properties. The following derivation loosely follows that of Kippenhahn, Weigert, and Weiss in Stellar Structure and Evolution.[5]
In our simple model, a star is assumed to consist of a fully convective interior inside of a fully radiative atmosphere.
The convective interior is assumed to be an ideal monatomic gas with a perfectly adiabatic temperature gradient:

This quantity is sometimes labelled . The following adiabatic equation therefore holds true for the entire interior:


![{\displaystyle {\begin{aligned}P&=NkT/V\\[1ex]&={\frac {\rho kT}{\mu _{H}}}\\[1ex]&=\left({\frac {k\rho }{\mu _{H}}}\right)^{\gamma }C\end{aligned}}}](https://wikimedia.org/api/rest_v1/media/math/render/svg/dee148e8345c661896ebb8ac6df827edf9a49abf)
where is the molecular weight per particle and H is (to a very good approximation) the mass of a hydrogen atom. This equation represents a polytrope of index 1.5, since a polytrope is defined by , where n=1.5 is the polytropic index. Applying the equation to the center of the star gives:


We can solve for C:

But for any polytrope, and . are all constants independent of pressure and density, and the average density is defined as . Plugging this 2 equations into the equation for C, we have:


We therefore have, for any star of mass M and radius R:

|
|
(1)
|

We need another relationship between P, T, M, and R, in order to eliminate P. This relationship will come from the atmosphere model.
The atmosphere is assumed to be thin, with average opacity k. Opacity is defined to be optical depth divided by density. Thus, by definition, the optical depth of the stellar surface, also called the photosphere, is:


The optical depth at the photosphere turns out to be . By definition, the temperature of the photosphere is where effective temperature is given by . Therefore, the pressure is:


We can approximate the opacity to be:


|
|
(2)
|

Finally, we need to eliminate R and introduce L, the luminosity. This can be done with the equation:

|
|
(3)
|

Equation 1 and 2 can now be combined by setting and in Equation 1, then eliminating . R can be eliminated using Equation 3. After some algebra, and after setting , we get:


In cool stellar atmospheres (T < 5000 K) like those of newborn stars, the dominant source of opacity is the H- ion, for which and , we get and .


Since A is much smaller than 1, the Hayashi track is extremely steep: if the luminosity changes by a factor of 2, the temperature only changes by 4 percent. The fact that B is positive indicates that the Hayashi track shifts left on the HR diagram, towards higher temperatures, as mass increases. Although this model is extremely crude, these qualitative observations are fully supported by numerical simulations.
At high temperatures, the atmosphere's opacity begins to be dominated by Kramers' opacity law instead of the H- ion, with a = 1 and b = −4.5. In that case, A = 0.2 in our crude model, far higher than 0.05, and the star is no longer on the Hayashi track.
In Stellar Interiors, Hansen, Kawaler, and Trimble go through a similar derivation without neglecting multiplicative constants,[6] and arrived at:


Numerical results edit

The diagram at the top of this article shows numerically computed stellar evolution tracks for various masses. The vertical portions of each track is the Hayashi track. The endpoints of each track lie on the main sequence. The horizontal segments for higher-mass stars show the Henyey track.
It is approximately true that:

The diagram to the right shows how Hayashi tracks change with changes in chemical composition. Z is the star's metallicity, the mass fraction not accounted for by hydrogen or helium. For any given hydrogen mass fraction, increasing Z leads to increasing molecular weight. The dependence of temperature on molecular weight is extremely steep—it is approximately


Chemical composition affects the Hayashi track in a few ways. The track depends strongly on the atmosphere's opacity, and this opacity is dominated by the H- ion. The abundance of the H- ion is proportional to the density of free electrons, which, in turn, is higher if there are more metals because metals are easier to ionize than hydrogen or helium.
Observational status edit

Observational evidence of the Hayashi track comes from color-magnitude plots—the observational equivalent of HR diagrams—of young star clusters.[1] For Hayashi, NGC 2264 provided the first evidence of a population of contracting stars. In 2012, data from NGC 2264 was re-analyzed to account for dust reddening and extinction. The resulting color-magnitude plot is shown at right.
In the upper diagram, the isochrones are curves along which stars of a certain age are expected to lie, assuming that all stars evolve along the Hayashi track. An isochrone is created by taking stars of every conceivable mass, evolving them forwards to the same age, and plotting all of them on the color-magnitude diagram. Most of the stars in NGC 2264 are already on the main sequence (black line), but a substantial population lies between the isochrones for 3.2 million and 5 million years, indicating that the cluster is 3.2-5 million years old and a large population of T Tauri stars is still on their respective Hayashi tracks. Similar results have been obtained for NGC 6530, IC 5146, and NGC 6611.[1]
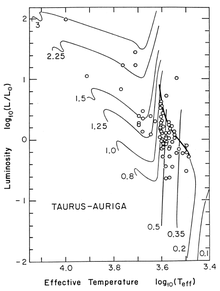
The lower diagram shows Hayashi tracks for various masses, along with T Tauri observations collected from a variety of sources. Note the bold curve to the right, representing a stellar birthline. Even though some Hayashi tracks theoretically extend above the birthline, few stars are above it. In effect, stars are 'born' onto the birthline before evolving downwards along their respective Hayashi tracks.
The birthline exists because stars formed from overdense cores of giant molecular clouds in an inside-out manner.[4] That is, a small central region first collapses in on itself while the outer shell is still nearly static. The outer envelope then accretes onto the central protostar. Before the accretion is over, the protostar is hidden from view, and therefore not plotted on the color-magnitude diagram. When the envelope finishes accreting, the star is revealed and appears on the birthline.
See also edit
References edit
- ^ a b c d Palla, Francesco (2012). "1961–2011: Fifty years of Hayashi tracks". First Stars IV: From Hayashi to the Future. AIP Conference Proceedings. Vol. 1480. pp. 22–29. Bibcode:2012AIPC.1480...22P. doi:10.1063/1.4754323. ISSN 0094-243X.
- ^ Hayashi, Chushiro (1961). "Stellar evolution in early phases of gravitational contraction". Publications of the Astronomical Society of Japan. 13: 450–452. Bibcode:1961PASJ...13..450H.
- ^ Hayashi, Chushiro (1961). "The Outer Envelope of Giant Stars with Surface Convection Zone". Publications of the Astronomical Society of Japan. 13: 442–449. Bibcode:1961PASJ...13..442H.
- ^ a b Stahler, Steven W. (1988). "Understanding young stars - A history". Publications of the Astronomical Society of the Pacific. 100: 1474. Bibcode:1988PASP..100.1474S. doi:10.1086/132352. ISSN 0004-6280. S2CID 121344832.
- ^ a b Stellar structure and evolution. New York: Springer. 2012. pp. 271–282. ISBN 978-3-642-30255-8.
- ^ Hansen, Carl J.; Kawaler, Steven D.; Trimble, Virginia (2004). Stellar interiors : physical principles, structure, and evolution. New York: Springer. pp. 367–374. ISBN 978-0-387-20089-7.