


Summary
The following is a list of all light rail systems in the United States, ranked by ridership. Also included are some of the urban streetcar/trolley systems that provide regular public transit service (operating year-round and at least five days/week), ones with data available from the American Public Transportation Association's (APTA) Ridership Reports. This list does not include statistics for metro/rapid transit systems (see: the List of United States rapid transit systems by ridership for those). Daily and annual ridership figures are based on "average weekday unlinked passenger trips" (where transfers between lines are counted as two separate passenger "boardings" or "trips"). References with supplementary (non-APTA) ridership figures are included in the System column.
List edit
| System | Largest city served |
Annual ridership 2023[1] | Avg. ridership weekdays, Q4 2023[2] | System length |
Avg. boardings per mile weekdays, Q4 2023 | Year opened |
Stations | Lines | Year last expanded | |
|---|---|---|---|---|---|---|---|---|---|---|
| 1 | San Diego Trolley[note 1] (incl. Silver Line[3][note 2]) |
San Diego | 38,438,000 | 130,500 | 65 mi (105 km)[4] | 2,008 | 1981[4] | 62[4] | 4[3][4] | 2021[4] |
| 2 | Metro Rail light rail:[note 3] A, C, E, & K lines |
Los Angeles | 36,082,100 | 120,100 | 94.5 mi (152.1 km)[5] | 1,271 | 1990[5] | 88[5] | 4[5] | 2023[5] |
| 3 | MBTA light rail:[note 3] Green Line & Ashmont–Mattapan High Speed Line[note 2] |
Boston | 34,581,000 | 80,300 | 26 mi (42 km)[6] | 3,088 | 1897[7] | 74[6] | 5[6] | 2022 |
| 4 | Link[note 1] (incl. T Line) |
Seattle | 27,338,200 | 78,600 | 20.4 mi (32.8 km)[8] | 3,853 | 2009 | 31[8] | 2[8] | 2024[9] |
| 5 | MAX Light Rail[note 1] | Portland | 23,446,700 | 74,800 | 60 mi (97 km) | 1,247 | 1986 | 97 | 5 | 2015 |
| 6 | Muni Metro[note 3][10] (incl. E Embarcadero[note 2] & F Market[11][12][note 2]) |
San Francisco | 24,324,600 | 75,500 | 35.7 mi (57.5 km)[13] | 2,115 | 1912[14] | 152[12][13] | 9[11][13] | 2022[15] |
| 7 | DART[note 1] | Dallas | 21,380,900 | 71,700 | 93 mi (150 km)[16] | 771 | 1996[17] | 64[16] | 4[18] | 2016[17] |
| 8 | NJ Transit:[note 3] Hudson–Bergen Light Rail, Newark Light Rail, River LINE,[19] |
Jersey City, Newark, Camden-Trenton | 20,827,300 | 57,100[note 4] | 59.9 mi (96.4 km)[19] | 953 | 1935 | 24[20] | 3[20] | 2011 |
| 9 | Denver RTD:[note 1] D, E, H, R, L, & W Lines |
Denver | 12,740,600 | 51,200 | 58.5 mi (94.1 km)[21] | 875 | 1994[22] | 62[21] | 8 | 2019[23] |
| 10 | METRO Light Rail[note 1] | Minneapolis-St. Paul | 14,755,900 | 46,500 | 21.8 mi (35.1 km)[24][25] | 2,133 | 2004[24] | 37[24][25] | 2[24][25] | 2014[25] |
| 11 | METRORail | Houston | 13,883,700 | 42,900 | 23.8 mi (38.3 km)[26][27] | 1,803 | 2004[27] | 44[26] | 3[26] | 2017[26] |
| 12 | SEPTA Metro light rail:[28][note 3] Subway–Surface Lines, Suburban Trolley Lines & Girard Ave Trolley[note 2] |
Philadelphia | 13,248,600 | 42,800 | 68.4 mi (110.1 km)[29][30] | 626 | 1906 | >100[29] | 8[29][30] | 2005 |
| 13 | TRAX (UTA) and S Line[note 1] | Salt Lake City | 11,043,800 | 37,700 | 46.8 mi (75.3 km)[31][32] | 806 | 1999[33] | 57[34] | 4[34] | 2013 |
| 14 | Valley Metro Rail[35] | Phoenix | 10,797,600 | 33,000 | 29.8 mi (48.0 km)[36] | 1,107 | 2008[37] | 41[38] | 1[37] | 2024[36] |
| 15 | Sacramento RT Light Rail | Sacramento | 6,580,000 | 22,200 | 42.9 mi (69.0 km)[39] | 517 | 1987[39] | 53[39] | 3[39] | 2015[39] |
| 16 | MetroLink | St. Louis | 6,717,900 | 19,400 | 46 mi (74 km)[40] | 422 | 1993[41] | 37[40] | 2[42] | 2006[43] |
| 17 | Charlotte Area Transit System: Blue and Gold Lines |
Charlotte | 6,118,300 | 18,200 | 20.8 mi (33.5 km)[44][45] | 875 | 2007[46] | 43[44][45] | 2[44] | 2021[47] |
| 18 | VTA light rail[note 1] | San Jose | 4,464,500 | 13,800 | 42.2 mi (67.9 km)[48] | 327 | 1987[48] | 62[48] | 3[48] | 2005[48] |
| 19 | Baltimore Light RailLink[note 3] | Baltimore | 3,546,300 | 12,500 | 33 mi (53 km)[49] | 379 | 1992 | 33[49] | 3[49] | 1997 |
| 20 | RTA Streetcars in New Orleans[note 2] |
New Orleans | 3,884,800 | 9,700 | 26.9 mi (43.3 km)[50] | 361 | 1835 | n/a[note 5] | 5[50] | 2018[50][51] |
| 21 | The T: Pittsburgh Light Rail |
Pittsburgh | 3,417,100 | 9,400[note 4] | 26.2 mi (42.2 km)[52] | 357 | 1984[note 6] | 53[52] | 3[52] | 2012[52] |
| 22 | Portland Streetcar[note 7] | Portland | 2,849,190[53] | 7,806[53] | 9.35 mi (15.05 km)[54] | 834 | 2001[54] | 76[54] | 3[54] | 2015[55] |
| 23 | Buffalo Metro Rail | Buffalo | 2,433,300 | 6,600 | 6.4 mi (10.3 km) | 1,031 | 1984 | 14[56] | 1[56] | 1986 |
| 24 | Sun Link | Tucson | 1,724,900 | 5,800 | 3.9 mi (6.3 km)[57] | 1,487 | 2014 | 22[57] | 1[57] | — |
| 25 | SPRINTER[note 1][58] | Oceanside | 1,362,600 | 5,600 | 22 mi (35 km)[59] | 255 | 2008[59] | 15[59] | 1[59] | — |
| 26 | KC Streetcar | Kansas City | 1,832,215[60] | 5,020[61] | 2.2 mi (3.5 km) | 2,281 | 2016 | 16[62] | 1 | 2016 |
| 27 | Seattle Streetcar[note 1] | Seattle | 1,326,500 | 4,200 | 3.8 mi (6.1 km) | 1,105 | 2007 | 21 | 2 | 2016 |
| 28 | TECO Line Streetcar | Tampa | 1,156,800 [citation needed] | 3,169[note 4] | 2.7 mi (4.3 km) | 1,173 | 2002 | 11 | 1 | 2010 |
| 29 | Tide Light Rail | Norfolk | 771,500 | 2,500 | 7.4 mi (11.9 km)[63] | 338 | 2011[64] | 11[63] | 1[63] | — |
| 30 | RTA Rapid Transit:[note 8] Blue, Green, and Waterfront Lines |
Cleveland | 661,500 | 2,500 | 15.3 mi (24.6 km)[65] | 163 | 1913[66] | 34[65] | 2[65] | 1996[66] |
| 31 | Q-Line | Detroit | 896,900[67] | 2,460[67] | 3.3 mi (5.3 km) | 745 | 2017 | 20 | 1 | — |
| 32 | Cincinnati Connector[68] | Cincinnati | 846,622[69] | 2,320[note 4][69] | 3.6 mi (5.8 km)[70] | 644 | 2016[71] | 18[70] | 1 | — |
| 33 | DC Streetcar | Washington, D.C. | 721,700 | 2,200 | 2.4 mi (3.9 km) | 917 | 2016 | 8 | 1 | — |
| 34 | Dallas Streetcar | Dallas | 701,904[72] | 1,923 [note 4] | 2.45 mi (3.94 km) | 784 | 2015 | 6 | 1 | 2016 |
| 35 | The Hop (streetcar) | Milwaukee | 453,269[73] | 1,241 | 2.1 mi (3.4 km) | 636 | 2018 | 10 | 1 | — |
| 36 | MATA Trolley | Memphis | 365,400 | 800 | 2 mi (3.2 km) | 400 | 1993 | 11[73] | 1[73] | 2004 |
| 37 | Atlanta Streetcar | Atlanta | 184,500 | 600 | 2.7 mi (4.3 km) | 222 | 2014 | 12 | 1 | — |
| 38 | El Paso Streetcar | El Paso | 65,400 | 400 | 4.8 mi (7.7 km) | 62 | 2018 | 27[74] | 2[74] | — |
Gallery edit
-
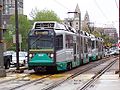 MBTA Green Line
 -
 LA Metro former (L) Line
 -
 Muni Metro's T Third line
 -
-

-
 DART Green Line
 -
-
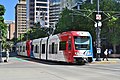
 METRO Blue Line
 -
 St. Louis MetroLink Train
 -
-

-
 Houston METRORail Red Line
 -
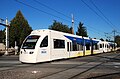
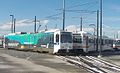
 Link Light Rail Line 1
 -
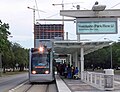
 Seattle Streetcar South Lake Union Line
 -
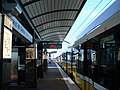
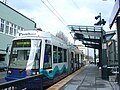 Link light rail T Line
 -
 Sun Link Streetcar


Systems excluded from ridership table edit
The following light rail systems have been excluded from the ridership table above:
| System | Largest city served | Opened | Route length | Reason(s) for exclusion from Ridership table |
|---|---|---|---|---|
| San Francisco cable car system | San Francisco, CA | 1873 | 5.1 mi (8.2 km) | APTA does not provide ridership figures for this system. |
| Lowell National Historical Park Trolley System | Lowell, MA | 1984[75] | 1.2 mi (1.9 km)[76] | Primarily a tourist system (does not operate daily, year-round). APTA does not provide ridership figures. |
| Galveston Island Trolley | Galveston, TX | 1988[77] | 6.8 mi (10.9 km)[77] | Non-operational; suspended since September 2008 due to damage from Hurricane Ike. |
| Kenosha Streetcars | Kenosha, WI | 2000[78] | 2.0 mi (3.2 km)[78] | Primarily a tourist system. APTA does not provide ridership figures. |
| Metro Streetcar | Little Rock, AR | 2004[79] | 3.4 mi (5.5 km)[79] | Primarily a tourist system. APTA does not provide ridership figures. |
| River Street Streetcar | Savannah, GA | 2009 | 1 mi (1.6 km) | Primarily a tourist system. APTA does not provide ridership figures. |
See also edit
- Light rail in the United States
- Light rail
- List of North American light rail systems by ridership
- Light rail in North America
- Streetcars in North America
- List of tram and light rail transit systems
- List of rail transit systems in the United States
- List of United States rapid transit systems by ridership
- List of North American rapid transit systems by ridership
- List of Latin American rail transit systems by ridership
- List of United States commuter rail systems by ridership
- List of United States local bus agencies by ridership
- Public transportation
Notes edit
- ^ a b c d e f g h i j This system also has available connections to a commuter rail system; the ridership figures and statistics presented here represent the light rail portion of the system only.
- ^ a b c d e f This line or system is operated using heritage streetcars.
- ^ a b c d e f This system also has a heavy rail rapid transit/metro portion (see List of metro systems), and connections to a commuter rail system; the ridership figures and statistics presented here represent the light rail portion of the system only.
- ^ a b c d e This is the Average Daily Ridership figure, not an "Average Weekday Ridership" figure – it is averaged from the 2022 Total Ridership figure for this system.
- ^ Uses streetcar-like surface stops
- ^ As current incarnation of light rail.
- ^ This system is owned by the City of Portland, which is not a member of APTA, and its ridership figures are not included in the APTA statistics for Portland.
- ^ This system also has a heavy rail rapid transit/metro portion (see List of metro systems); the ridership figures and statistics presented here represent the light rail portion of the system only.
References edit
- ^ "Transit Ridership Report Fourth Quarter 2023" (PDF). American Public Transportation Association. March 4, 2024. Retrieved March 14, 2024.
- ^ "Transit Ridership Report Fourth Quarter 2023" (PDF). American Public Transportation Association. March 4, 2024. Retrieved March 14, 2024.
- ^ a b "Vintage Trolley". San Diego Metropolitan Transit System. May 22, 2015. Retrieved December 30, 2015.
- ^ a b c d e "About MTS". San Diego Metropolitan Transit System. November 2021. Retrieved November 27, 2021.
- ^ a b c d e "Metro – Facts at a Glance". Los Angeles County Metropolitan Transportation Authority (Metro). February 22, 2023. Retrieved January 17, 2019.
- ^ a b c "About the T – Financials – Appendix: Statistical Profile" (PDF). Massachusetts Bay Transportation Authority. 2007. pp. 103–104. Archived from the original (PDF) on March 3, 2016. Retrieved July 13, 2013.
- ^ "MTBA – About the MTBA – History – The Rapid Transit Commission and the BERY". Massachusetts Bay Transportation Authority. 2013. Retrieved August 7, 2013.
- ^ a b c "Service Maps | Sound Transit". Sound Transit. Sound Transit. March 2024. Archived from the original on March 29, 2024. Retrieved March 21, 2024.
{{cite web}}: CS1 maint: date and year (link) - ^ "Light rail opens on the Eastside". Sound Transit. Retrieved April 28, 2024.
- ^ "TEP Route Data & Proposed Changes". San Francisco Municipal Transportation Agency (SFMTA). Retrieved December 15, 2013.
- ^ a b "F Market & Wharves | SFMTA". San Francisco Municipal Transportation Agency. 2013. Retrieved August 25, 2013.
- ^ a b "Rider Information – Market Street Railway". Market Street Railway. Retrieved August 18, 2013.
- ^ a b c "Muni Metro Light Rail | SFMTA". San Francisco Municipal Transportation Agency. 2013. Retrieved June 30, 2013.
- ^ McKane, John; Perles, Anthony (1982). Inside Muni: The Properties and Operations of the Municipal Railway of San Francisco. Glendale, CA: Interurban Press. p. 174. ISBN 978-0-916374-49-5.
- ^ fpadmin (January 25, 2013). "Central Subway Project". SFMTA. Retrieved December 6, 2022.
- ^ a b "Facts about Dallas Area Rapid Transit (DART)". Dallas Area Rapid Transit. February 26, 2013. Retrieved July 23, 2013.
- ^ a b "DART.org – DART History". Dallas Area Rapid Transit. 2015. Retrieved January 12, 2015.
- ^ "DART.org – DART Schedules". Dallas Area Rapid Transit. 2013. Retrieved August 25, 2013.
- ^ a b "NJ TRANSIT Annual Report" (PDF). New Jersey Transit. Retrieved April 4, 2020.
- ^ a b "Hudson-Bergen – Light Rail" (PDF). NJ Transit. March 2013. Archived from the original (PDF) on October 9, 2015. Retrieved July 14, 2013.
- ^ a b "RTD – Facts & Figures". Regional Transportation District. February 2017. Archived from the original on July 26, 2015. Retrieved April 17, 2017.
- ^ "RTD – Facts & Figures – Central Corridor Light Rail Line". Regional Transportation District. January 2013. Retrieved July 23, 2013.
- ^ "FasTracks Southeast Rail Extension". Regional Transportation District. Retrieved April 23, 2020.
- ^ a b c d "METRO Blue Line – Facts About Trains and Construction". Metro Transit. 2013. Archived from the original on February 14, 2014. Retrieved June 15, 2014.
- ^ a b c d "Metro Green Line Fact Sheet". Metropolitan Council. June 14, 2014. Archived from the original on June 12, 2014. Retrieved June 15, 2014.
- ^ a b c d "METRORail". Metropolitan Transit Authority of Harris County, Texas. October 7, 2015. Retrieved August 11, 2015.
- ^ a b "Houston Facts 2014" (PDF). METRO. 2014. Archived from the original (PDF) on September 24, 2015. Retrieved August 11, 2015.
- ^ "SEPTA – Trolley Lines". Southeastern Pennsylvania Transportation Authority. Retrieved June 28, 2013.
- ^ a b c "SEPTA – Spring 2012 Route Statistics" (PDF). Southeastern Pennsylvania Transportation Authority. 2012. Archived from the original (PDF) on May 24, 2013. Retrieved June 28, 2013.
- ^ a b "SEPTA – Media Guide" (PDF). Southeastern Pennsylvania Transportation Authority. 2013. Archived from the original (PDF) on April 17, 2018. Retrieved July 17, 2013.
- ^ "Front Lines 2015 Map" (PDF). Utah Transit Authority. Archived from the original (PDF) on November 25, 2013. Retrieved July 2, 2013.
- ^ Vo-Duc, Viviane (September 5, 2013). "New streetcar S-line set to open Dec. 8 in Sugar House". deseretnews.com.
- ^ "UTA History – Fact Sheet History 2012" (PDF). Utah Transit Authority. April 2013. Archived from the original (PDF) on January 21, 2013. Retrieved August 11, 2013.
- ^ a b "Rail and BRT Map". Utah Transit Authority. August 2022. Retrieved September 23, 2022.
- ^ "Ridership Reports". Valley Metro. 2013. Retrieved December 1, 2013.
- ^ a b "Light rail to reach eastern end of the line with opening of Mesa extension". azcentral. Retrieved August 6, 2019.
- ^ a b "Light Rail System 2011 Facts and Figures" (PDF). Valley Metro. August 14, 2012. Archived from the original (PDF) on June 3, 2013. Retrieved July 15, 2013.
- ^ "Valley Metro Expands Safe Place". Valley Metro. March 21, 2016. Archived from the original on April 1, 2016. Retrieved March 29, 2016.
- ^ a b c d e "Sacramento Regional Transit District: Fact Sheet" (PDF). Sacramento Regional Transit District. May 2016. Retrieved June 22, 2016.
- ^ a b "Procurement Information". Bi-State Development Agency (Metro). 2010. Archived from the original on August 18, 2013. Retrieved August 11, 2013.
- ^ "History – The 1990s – MetroLink". Bi-State Development Agency (Metro). 2010. Archived from the original on August 23, 2013. Retrieved August 11, 2013.
- ^ "Procurement Information" (PDF). Bi-State Development Agency (Metro). Archived from the original (PDF) on March 28, 2016. Retrieved August 25, 2013.
- ^ "History – 2000 to Today – MetroLink". Bi-State Development Agency (Metro). 2010. Archived from the original on August 23, 2013. Retrieved August 25, 2013.
- ^ a b c "LYNX Home". Charlotte Area Transit System (CATS). Retrieved August 7, 2013.
- ^ a b "LYNX Blue Line Extension Service Update". City of Charlotte Government.
- ^ "LYNX Blue Line Recognizes Ridership Success During Week of Five-Year Anniversary". Charlotte Area Transit System (CATS). November 28, 2012. Retrieved August 7, 2013.
- ^ Sheldon, Juliann (August 26, 2021). "CityLYNX Gold Line Streetcar to Open for Passenger Service on Aug. 30". City of Charlotte. Archived from the original on August 27, 2021. Retrieved December 1, 2021.
- ^ a b c d e "VTA Facts: Light Rail System Overview" (PDF). Santa Clara Valley Transportation Authority (VTA). November 14, 2012. Archived from the original (PDF) on August 20, 2013. Retrieved June 30, 2013.
- ^ a b c "Visitors Ride Guide" (PDF). Maryland Transit Administration. Retrieved July 14, 2013 – via http://mta.maryland.gov/content/visitors.
{{cite web}}: External link in|via= - ^ a b c "Agency Profile: New Orleans Regional Transit Authority" (PDF). National Transit Database. 2016. Retrieved October 5, 2018.
- ^ "RTA will open its Cemeteries Transit Center to streetcars this Sunday". Curbed New Orleans. Retrieved October 5, 2018.
- ^ a b c d "Port Authority of Allegheny County – Company Info & Projects – Agency Profile". Port Authority of Allegheny County (PAT). 2013. Archived from the original on July 3, 2013. Retrieved July 15, 2013.
- ^ a b "Portland Streetcar Ridership Performance" (PDF). Portland Streetcar. Retrieved April 4, 2020.
- ^ a b c d "Maps + Schedules - Portland Streetcar". Portland Streetcar. Portland Streetcar, Inc. Archived from the original on March 31, 2024. Retrieved April 24, 2024.
- ^ "Loop Service - Portland Streetcar". August 6, 2015. Archived from the original on August 6, 2015.
- ^ a b "Metro Rail 7 Day Timetable" (PDF). NTFA-Metro. July 2, 2013. Archived from the original (PDF) on October 2, 2013. Retrieved August 7, 2013.
- ^ a b c "Why do we need a streetcar? – The streetcar route". Sun Link Tucson Streetcar. Archived from the original on September 7, 2015. Retrieved April 2, 2015.
- ^ "SPRINTER Fact Sheet" (PDF). North County Transit District. January 2013. Retrieved July 28, 2013.
- ^ a b c d "Nctd sprinter". North County Transit District (San Diego). 2013. Retrieved June 30, 2013.
- ^ "Ride KC Streetcar Ridership and Performance December 2023" (PDF). Ride KC Streetcar. December 2023. Retrieved January 25, 2024.
- ^ "Ride KC Streetcar Ridership and Performance December 2023" (PDF). Ride KC Streetcar. December 2023. Retrieved January 25, 2024.
- ^ "The KC Streetcar - FAQs". Retrieved December 8, 2017.
- ^ a b c "The Tide – Hampton Roads Transit". Hampton Roads Transit. 2013. Archived from the original on June 16, 2012. Retrieved July 15, 2013.
- ^ "Light Rail Service to Begin August 19, 2011". Hampton Roads Transit. Archived from the original on January 2, 2014. Retrieved August 10, 2013.
- ^ a b c "2012 Annual Report – Greater Cleveland Regional Transit Authority". Greater Cleveland Regional Transit Authority. December 31, 2012. Retrieved July 21, 2013.
- ^ a b "About RTA: History of Public Transit in Greater Cleveland". Greater Cleveland Regional Transit Authority. 2012. Retrieved July 21, 2013.
- ^ a b "QLINE's limitations reflect regional transit failures holding back Detroiters". Bridge Detroit. June 28, 2023. Retrieved September 6, 2023.
- ^ "Cincinnati Connector". City of Cincinnati. 2016. Retrieved September 10, 2016.
- ^ a b "Streetcar Ridership". Cincinnati Bell Connector. Retrieved September 6, 2023.
- ^ a b "Design & Route". City of Cincinnati. 2016. Retrieved September 10, 2016.
- ^ Coolidge, Sharon (September 9, 2016). "It's a go: Streetcar finally opens". The Cincinnati Enquirer. Retrieved September 10, 2016.
- ^ "DART Scorecard". Dallas Area Rapid Transit. Retrieved September 6, 2023.
- ^ a b c The Hop MKE - Ridership
- ^ a b Streetcar work on time, budget
- ^ "Lowell National Historical Park, Massachusetts : The Trolleys". National Park Service. National Park Service (U.S. Department of the Interior). Retrieved January 6, 2023.
- ^ "U.S. Streetcar Systems- Massachusetts – Lowell". Railway Preservation. Retrieved January 6, 2023.
- ^ a b "Island Transit Information". Island Transit. Retrieved August 21, 2013.
- ^ a b "Streetcar Route Map" (PDF). Kenosha Streetcars Today. Retrieved July 14, 2013 – via http://www.kenoshastreetcarsociety.org/today.
{{cite web}}: External link in|via= - ^ a b "River Rail – Central Arkansas Transit Authority". Central Arkansas Transit Authority (CATA). Archived from the original on September 2, 2013. Retrieved August 18, 2013.